This year's gas market may be tighter than many realize. So far this winter, we have been depleting inventories at a rapid clip, despite the mild weather in November through January. Our models show that the supply-demand balance has recently averaged 2 Bcf/d tighter than the next closest year (2017). If the trend continues, gas prices may have more room to run during the upcoming summer and winter seasons.

Last week, frigid weather caused the largest temperature-adjusted pull on inventories since early 2018, and the second-largest on record. The draw was even more impressive when adjusting for weather, and supply disruptions enhanced the inventory drawdown, as freeze-offs knocked out nearly 17 Bcf/d of supply at the peak.

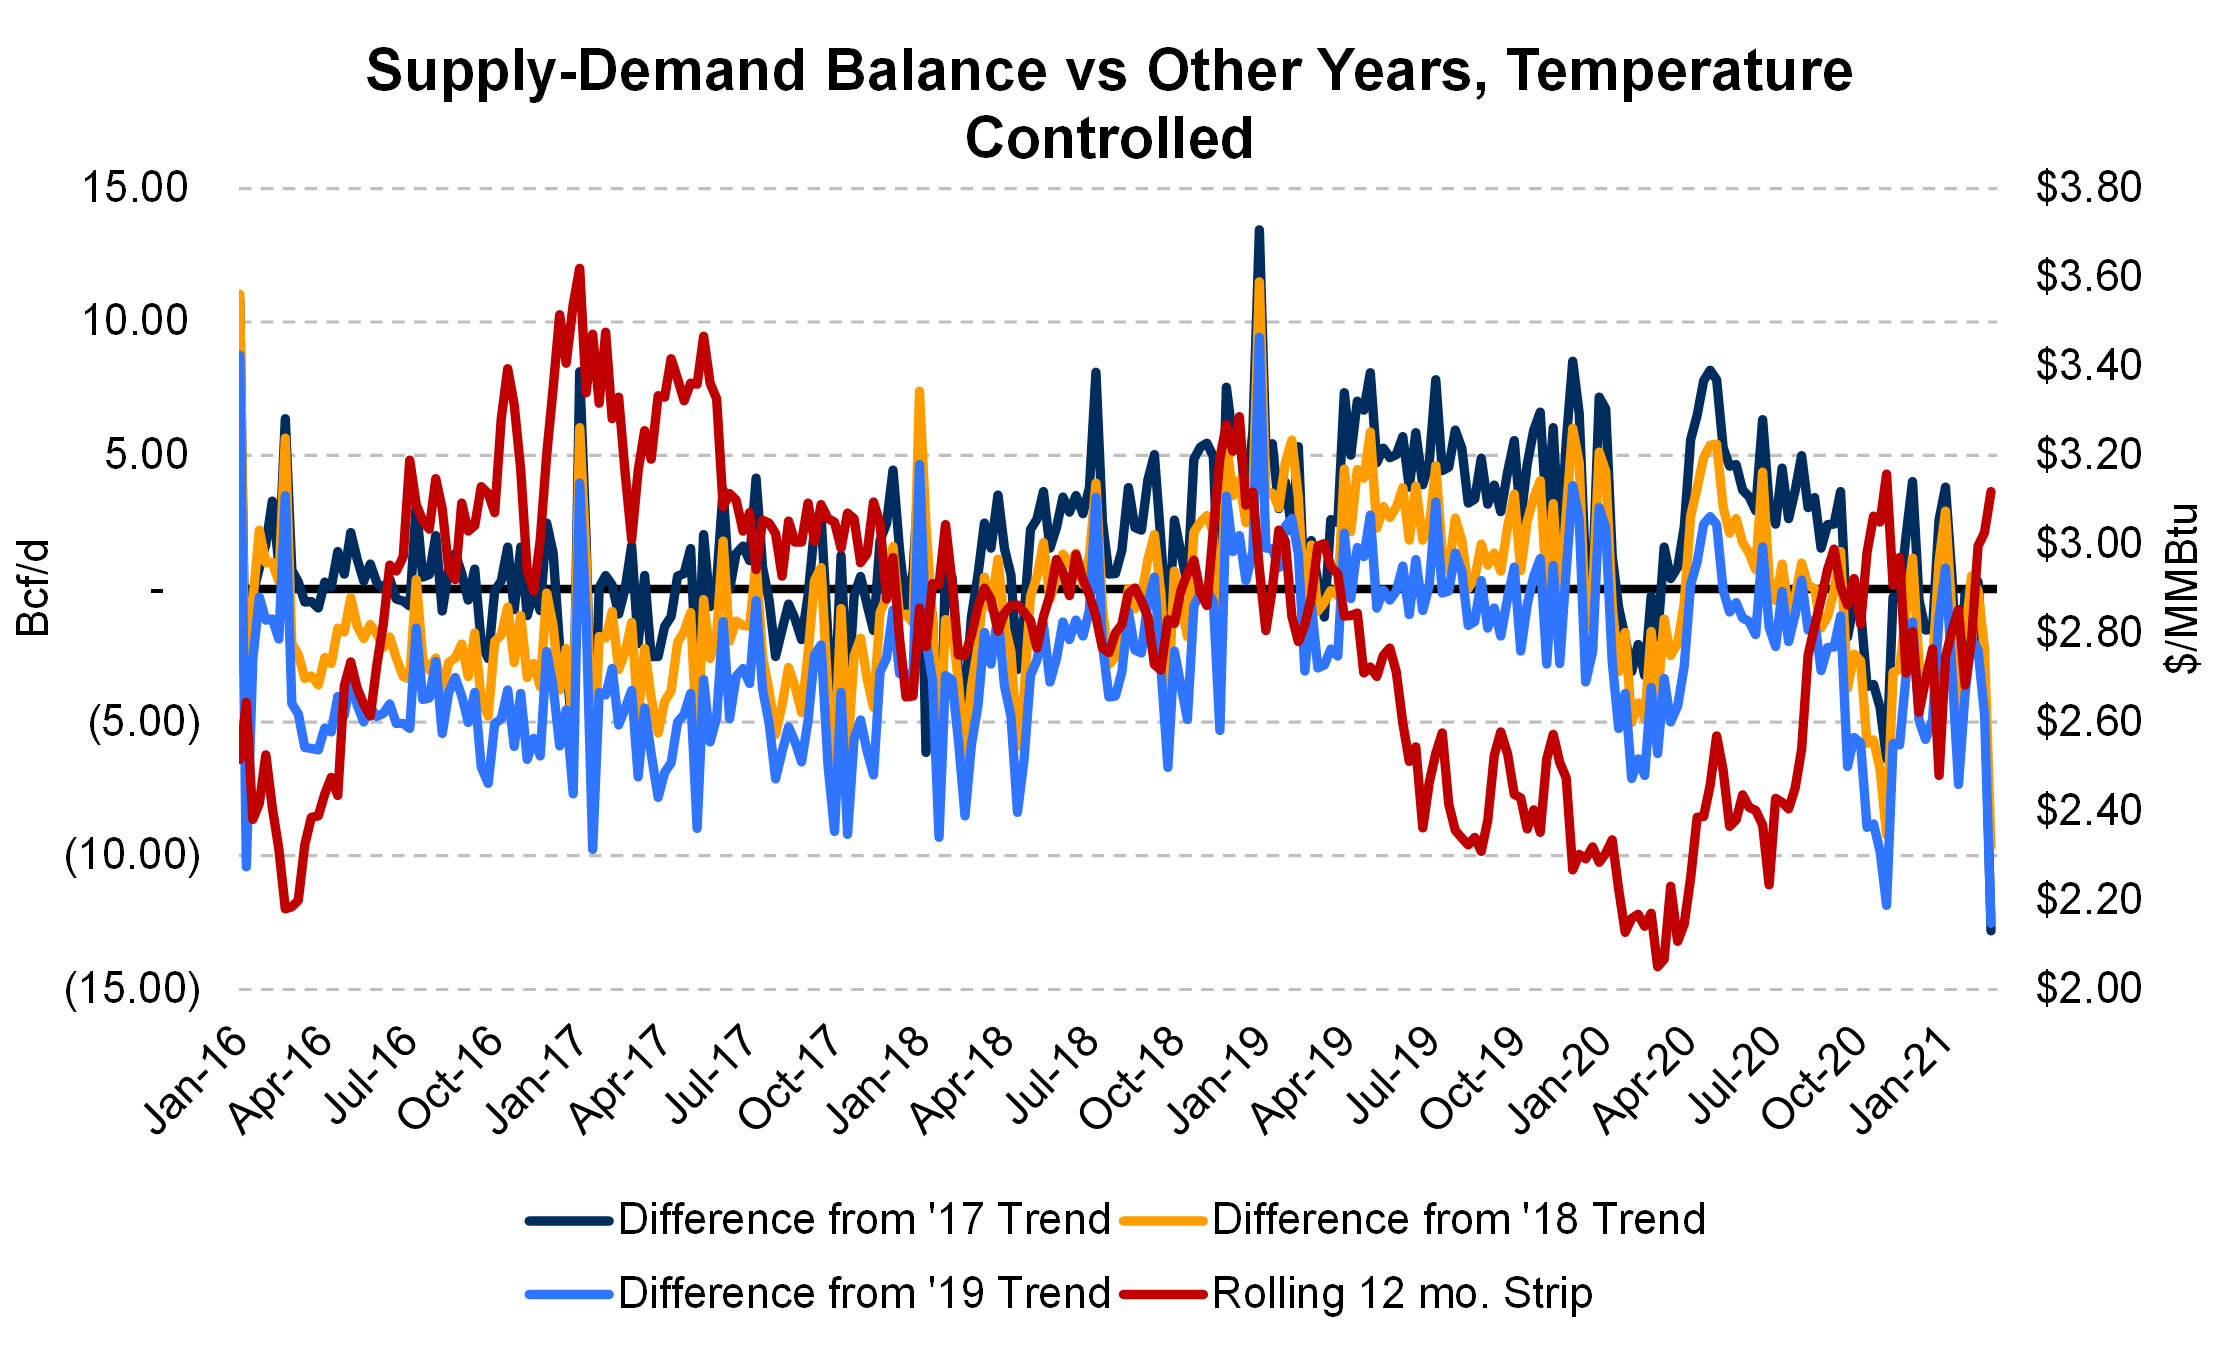
The chart above shows how each EIA announced storage withdrawal or injection compares to other years', adjusting for weather. The dark blue line (2017) will therefore average zero in 2017, the yellow line (2018) average zero in 2018, and so on. When the dark blue, light blue, and yellow lines are rising, the market is tilting toward more net supply. If a line is shifting lower, it's bullish.
The chart also shows how price responds to the market's balance. When the temperature-adjusted withdrawal rate strengthens (moves lower), a rally in Henry Hub futures usually occurs. More net supply (the lines move higher) usually weakens prices.
Since September, the market has been in a bullish temperature-adjusted withdrawal pattern.
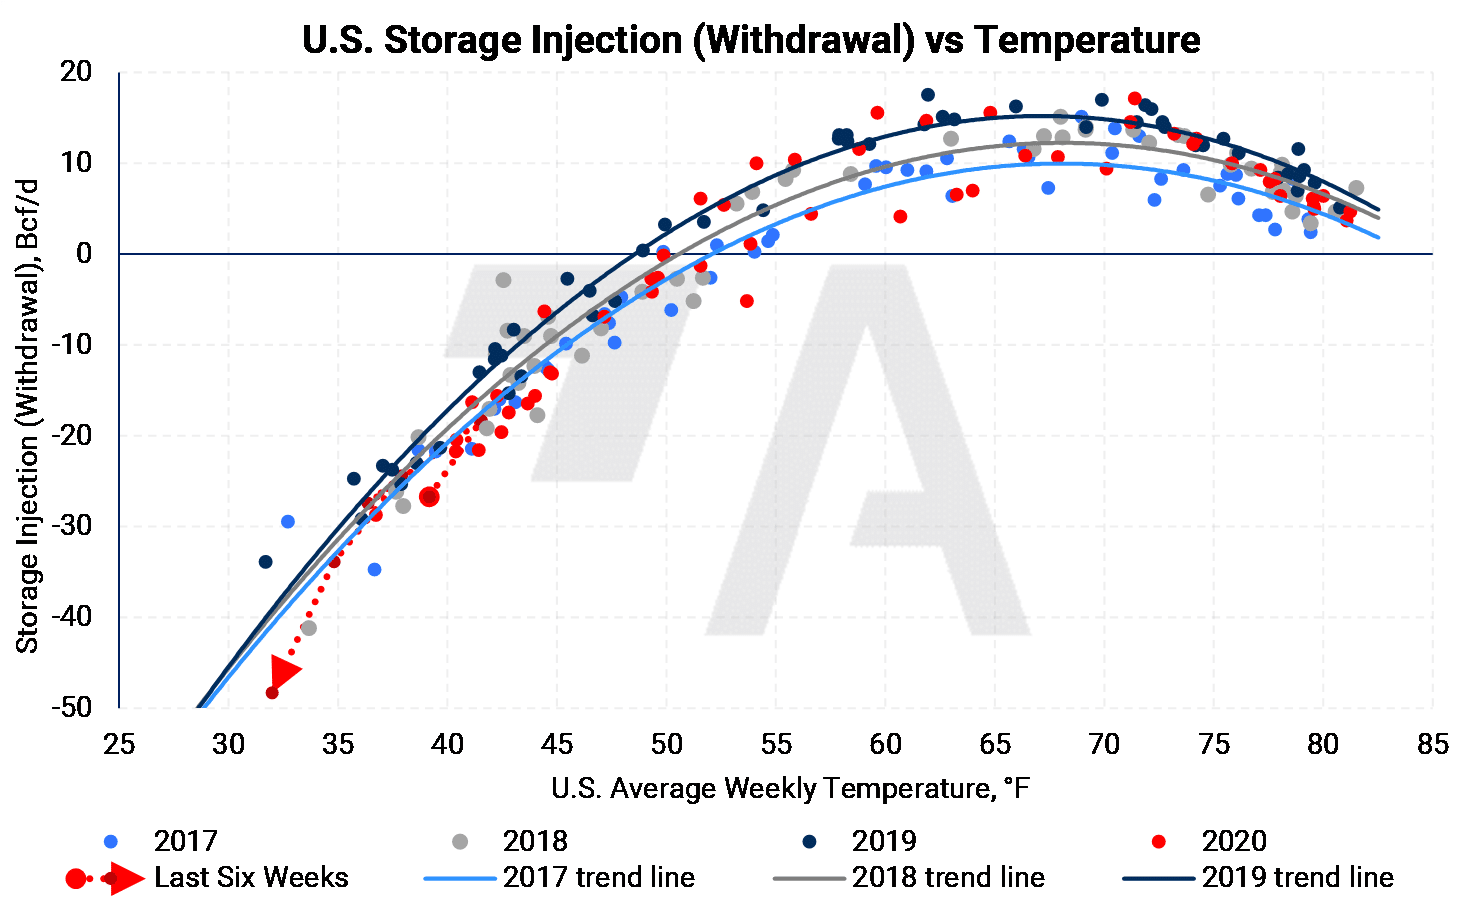
By this model, the market is around 2 Bcf/d tighter than it was in 2017. This corresponds to the first chart, where the last six weeks have been closest to the 2017 trendline, but underneath it by an average 2 Bcf/d.
If this supply-demand balance holds, we could finish the summer season injecting about 420 (210 days * 2 Bcf/d) Bcf less than we otherwise would have.
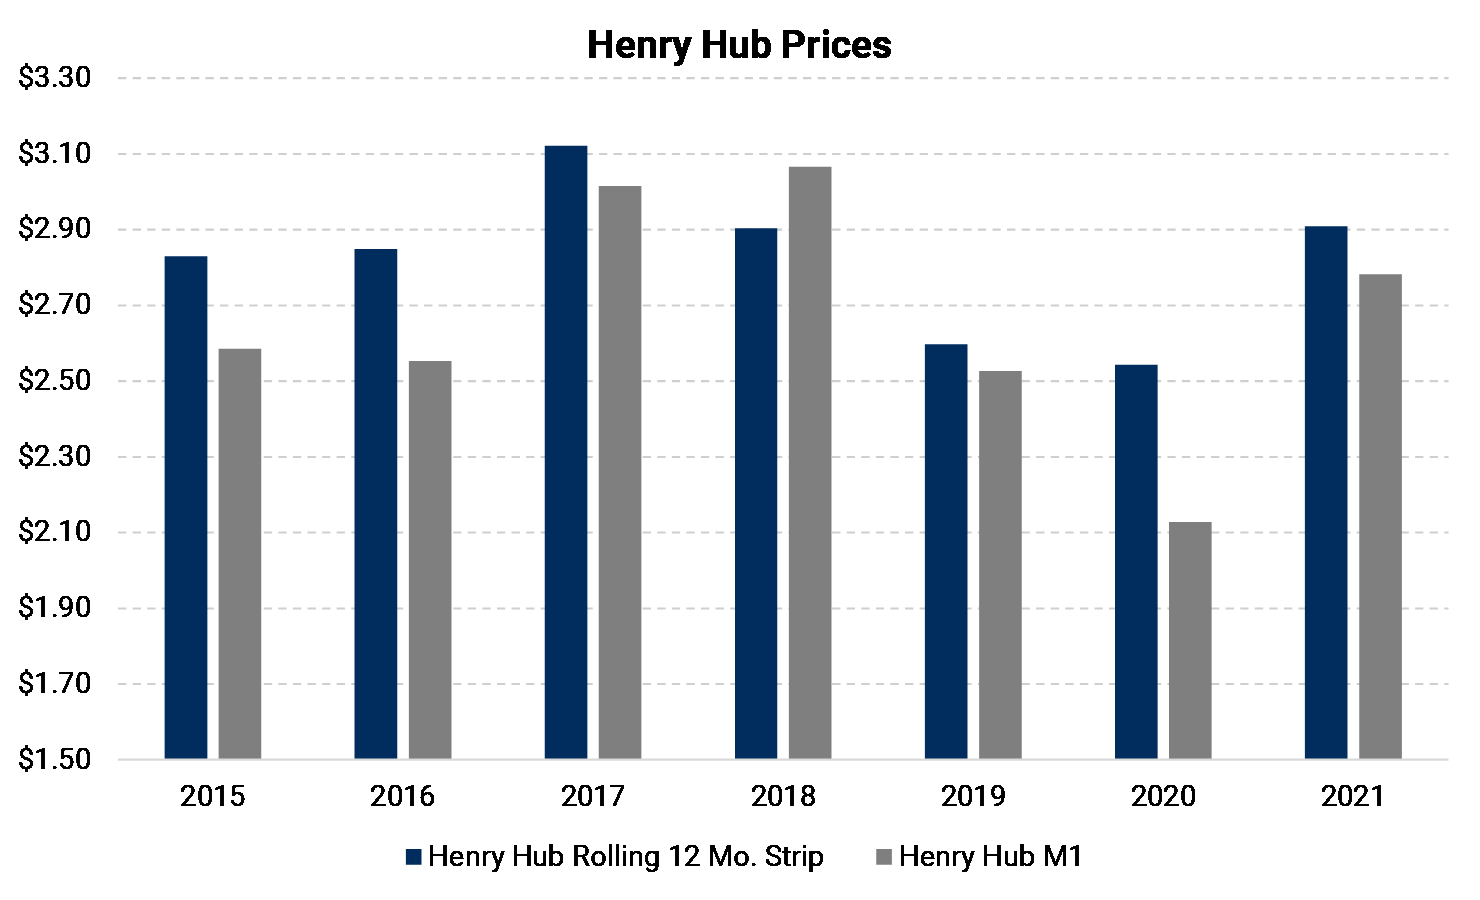
Why is this a good sign? 2017 was an excellent year for gas prices, as indicated in the column chart below. Both the rolling 12-month strip and prompt-month prices were at their highest levels in recent years, and you can see how prices are averaging in 2021 thus far. The rate at which inventories are being depleted adds to our constructive outlook for prices in Summer 2021 and Winter 2021-2022.

Commodity Interest Trading involves risk and, therefore, is not appropriate for all persons; failure to manage commercial risk by engaging in some form of hedging also involves risk. Past performance is not necessarily indicative of future results. There is no guarantee that hedge program objectives will be achieved. Certain information contained in this research may constitute forward-looking terminology, such as "edge," "advantage," 'opportunity," "believe," or other variations thereon or comparable terminology. Such statements and opinions are not guarantees of future performance or activities. Neither this trading advisor nor any of its trading principals offer a trading program to clients, nor do they propose guiding or directing a commodity interest account for any client based on any such trading program.