With insufficient oil production from OPEC+, minimal supply additions from the U.S., and air and road travel returning, this is a recipe for price escalation among distillates, jet and diesel (or heating oil) this winter and in 2022.
Already understand the relationship between jet prices, cracks, and crude? We’re not trying to get you to look at ads, so feel free to jump to the oil discussion.
The chart below shows New York jet fuel prices against Brent crude oil prices back to January 2019. Jet’s prevailing price before the COVID-19 pandemic was around $20/Bbl over Brent, but the changes in jet and crude were almost identical on a daily or weekly basis.
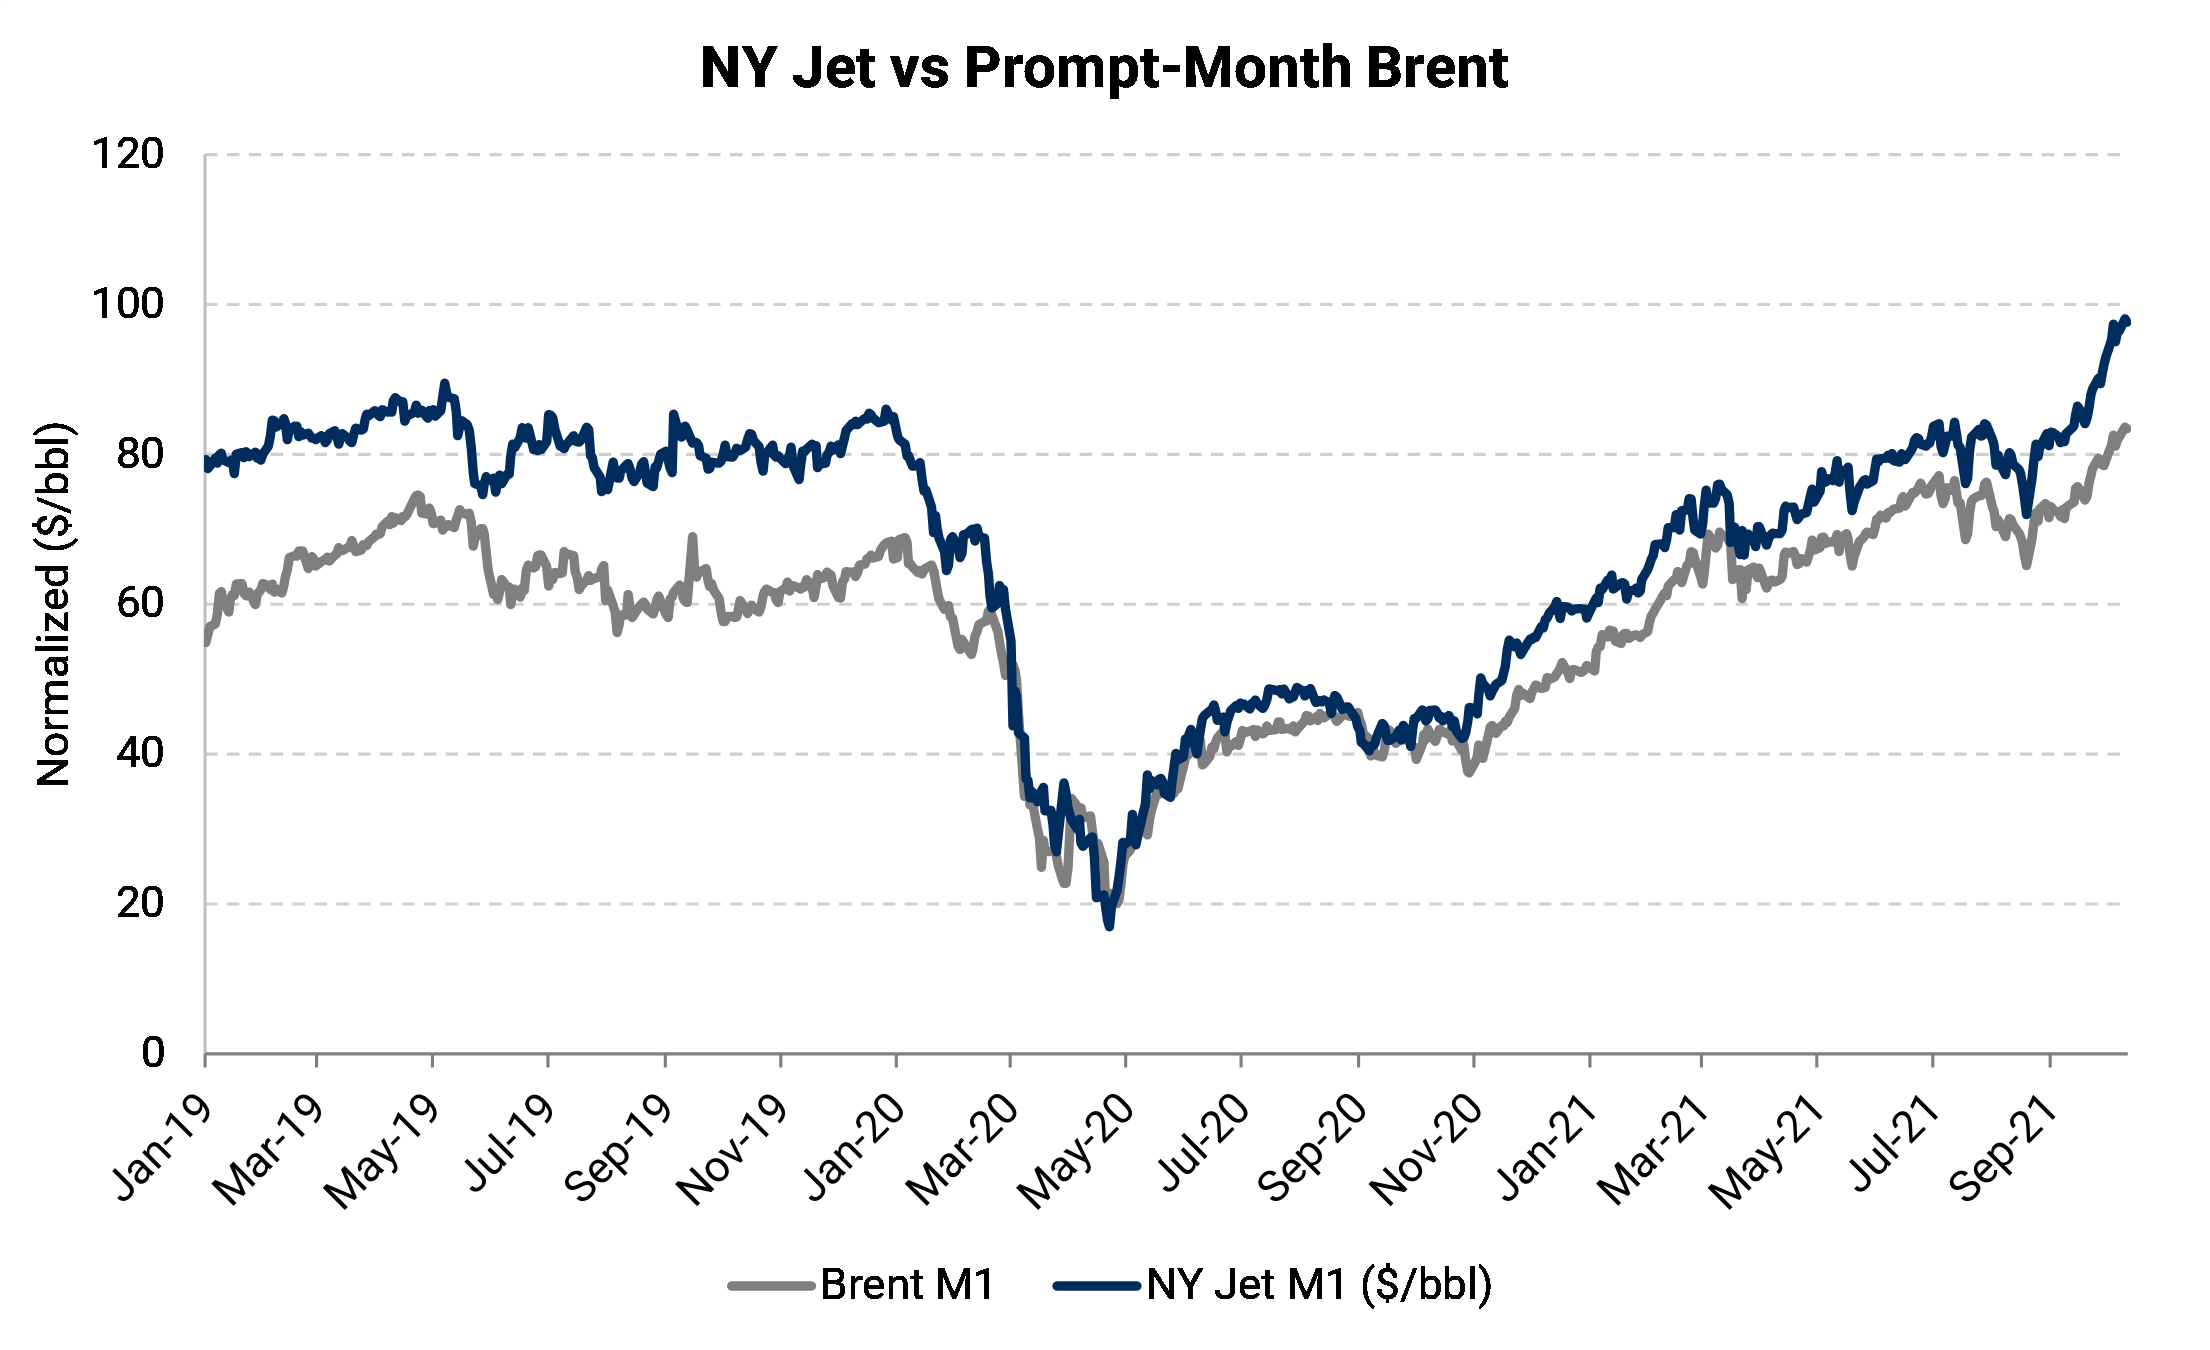
When COVID-19 erased travel demand for fuels, the price of jet collapsed to that of crude oil. This means that refineries were unable to make a profit creating jet fuel. But even after price drop in jet, the ongoing relationship with Brent persisted.
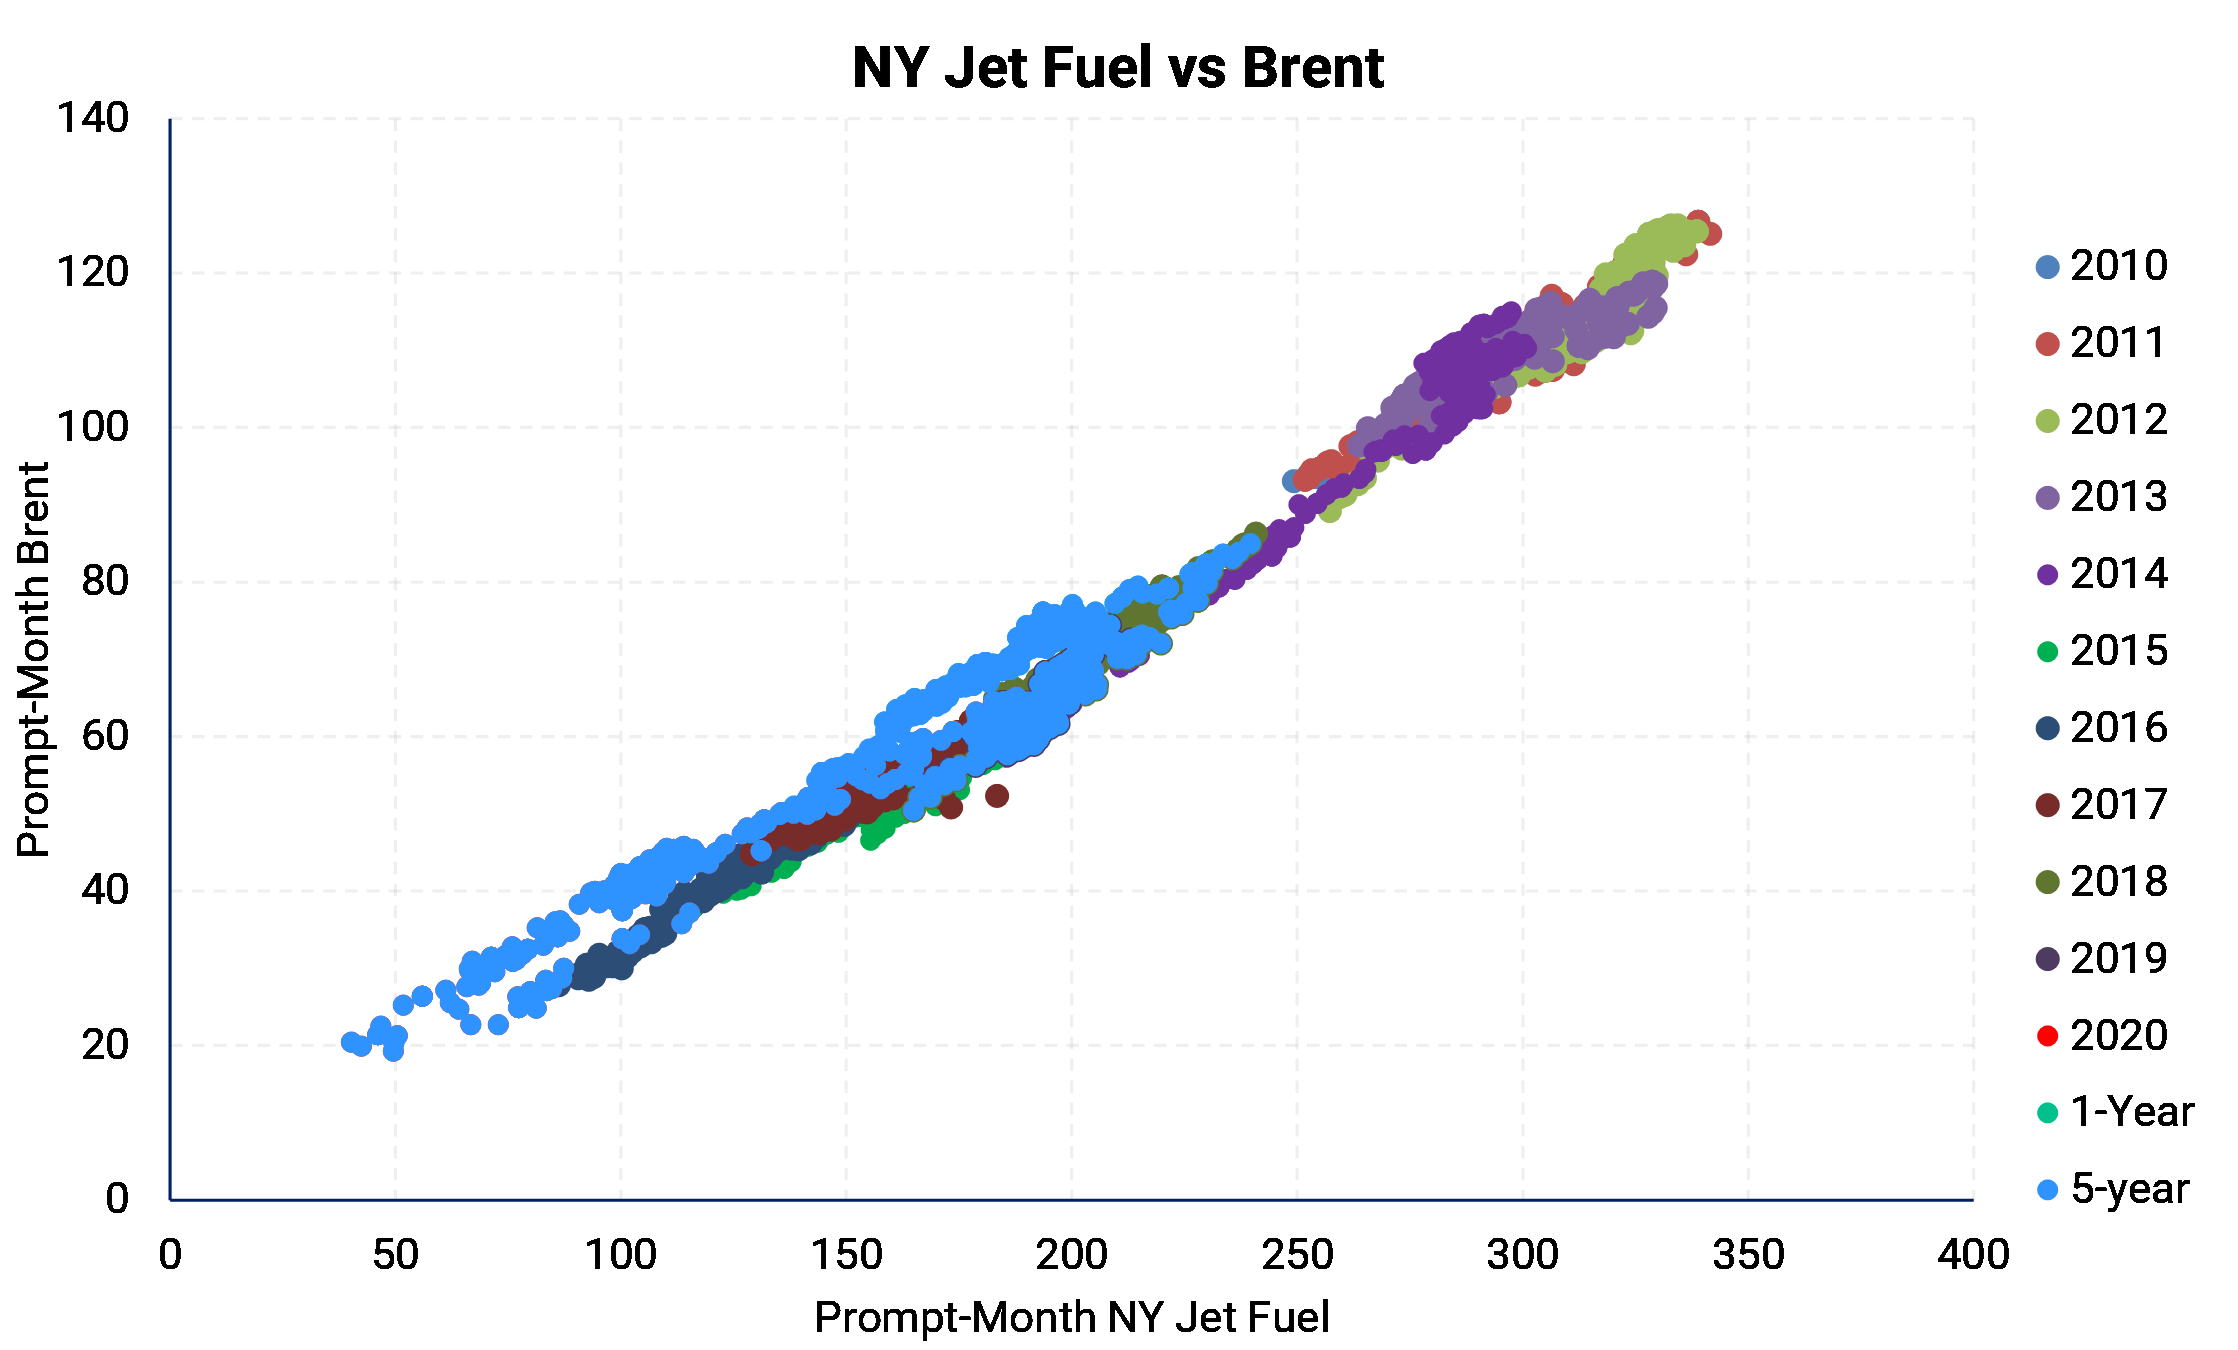
The scatterplot shown below demonstrates how tight that relationship is. Whether oil prices are high or low, jet very reliably has followed Brent prices. Of course, this analysis is only for New York jet versus Brent crude oil, but we find the same relationship in other regions when we match the correct oil market to the jet-fuel market in question.
Jet prices, or any fuel price, can be disaggregated into the input crude oil price and the “crack,” or the price spread between the fuel and the crude. It’s the refinery’s gross margin:
Jet = Crude + (Jet – Crude) = Crude + Jet – Crude = Jet
Or, Jet = Crude + ( Jet Crack ) = = Jet
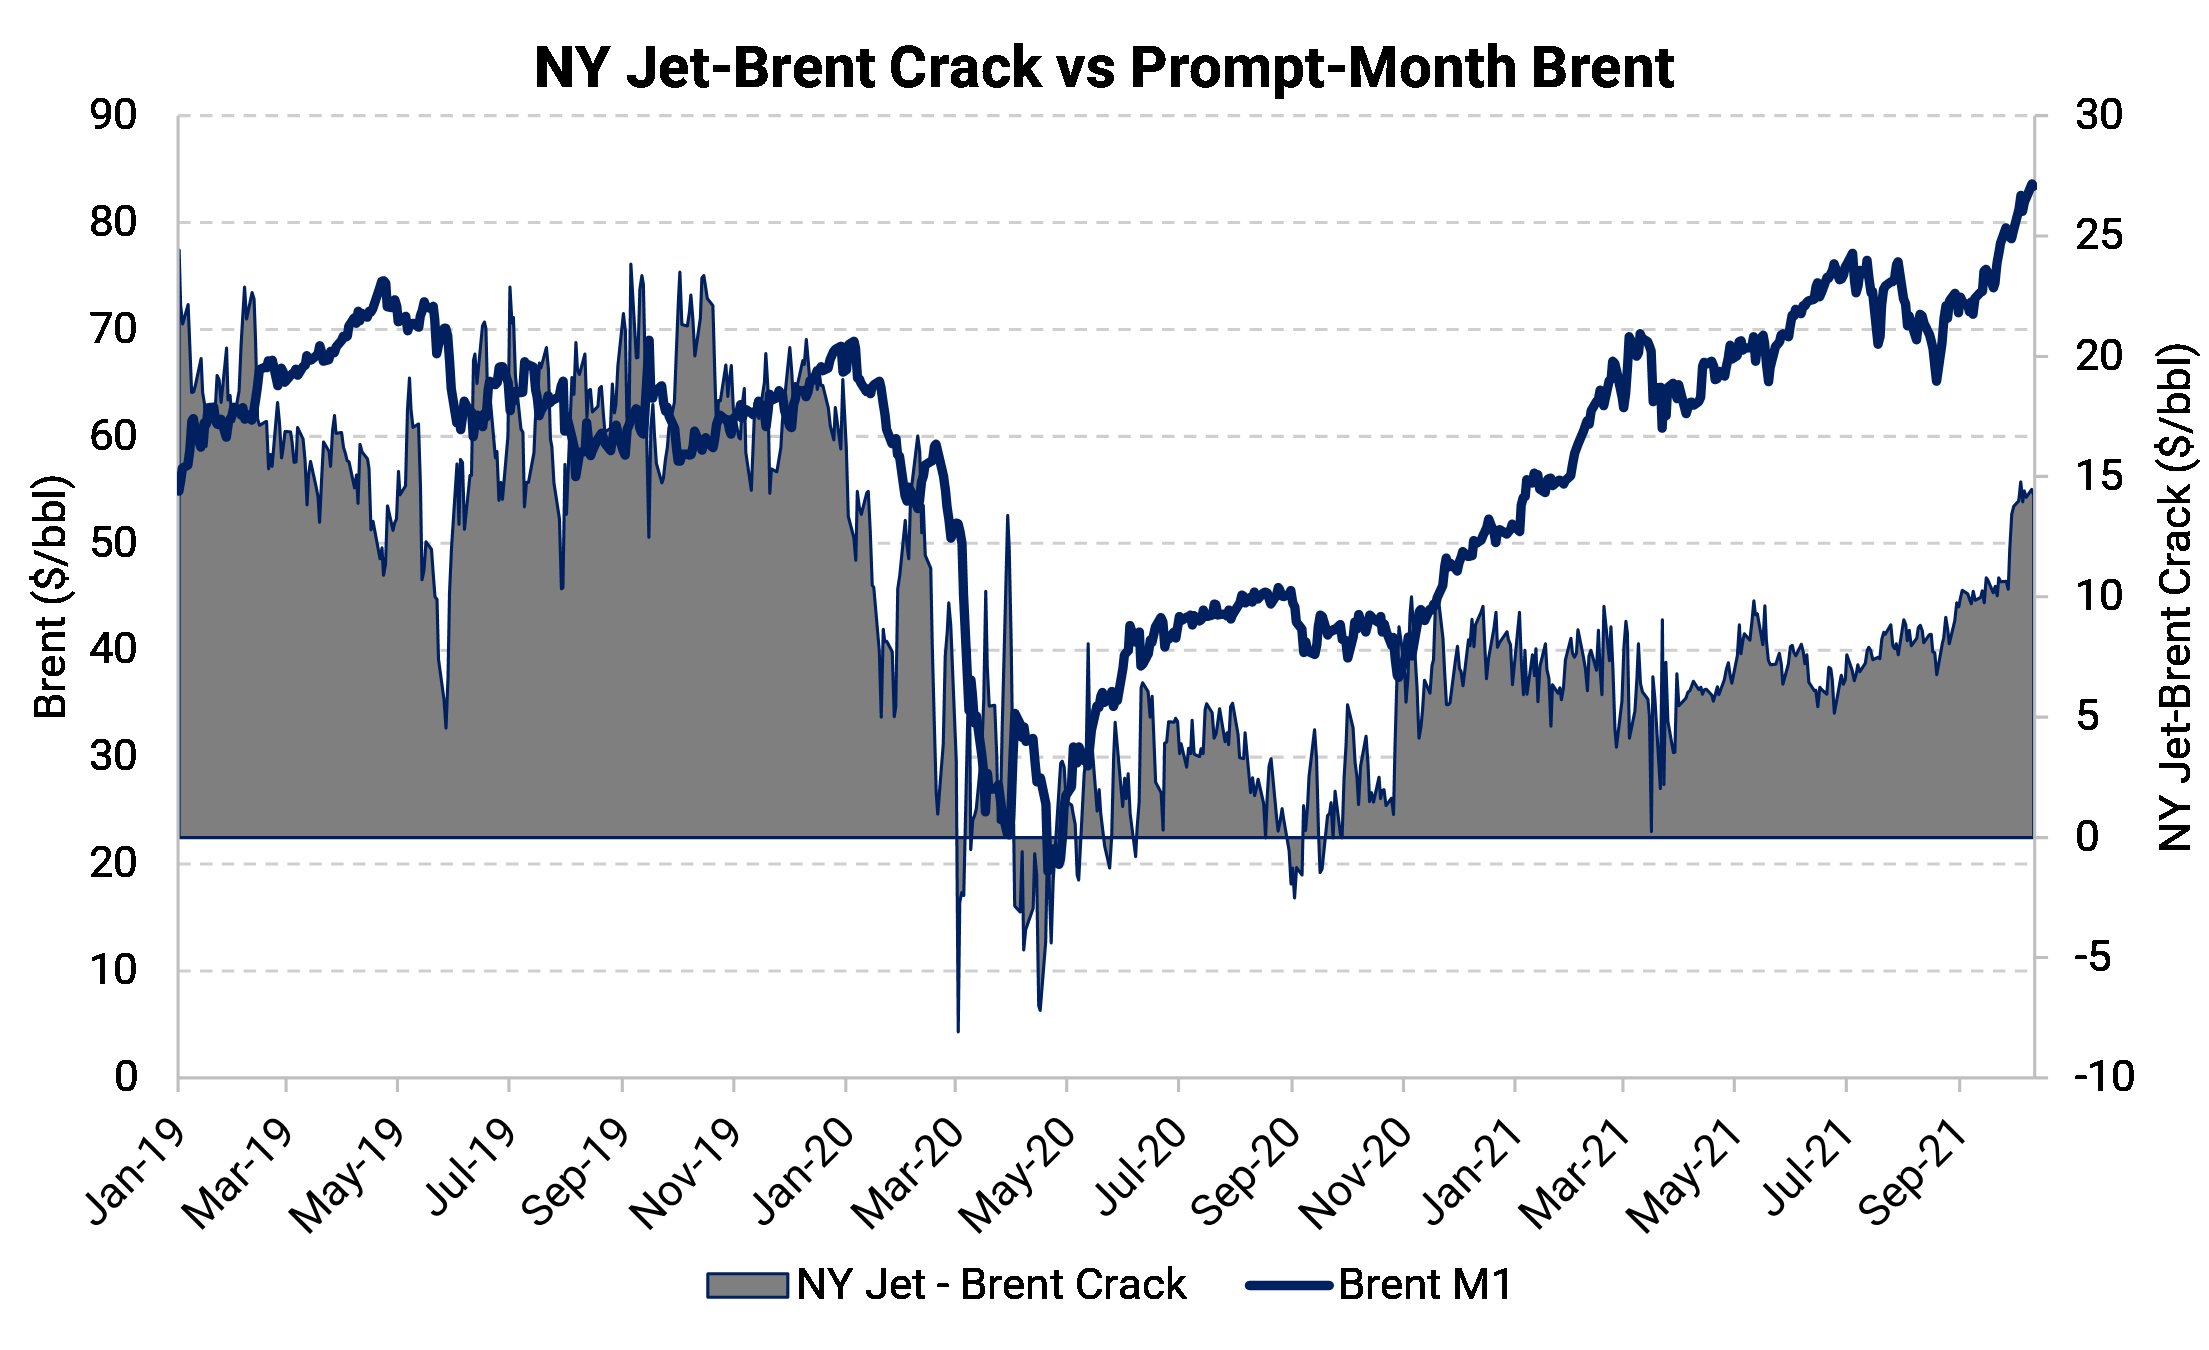
For example, in the chart below, we show how the Jet Crack went negative at the onset of the COVID-19 pandemic in April 2020. At that time, Jet was so cheap because BOTH crude oil and Jet Crack were cheap.
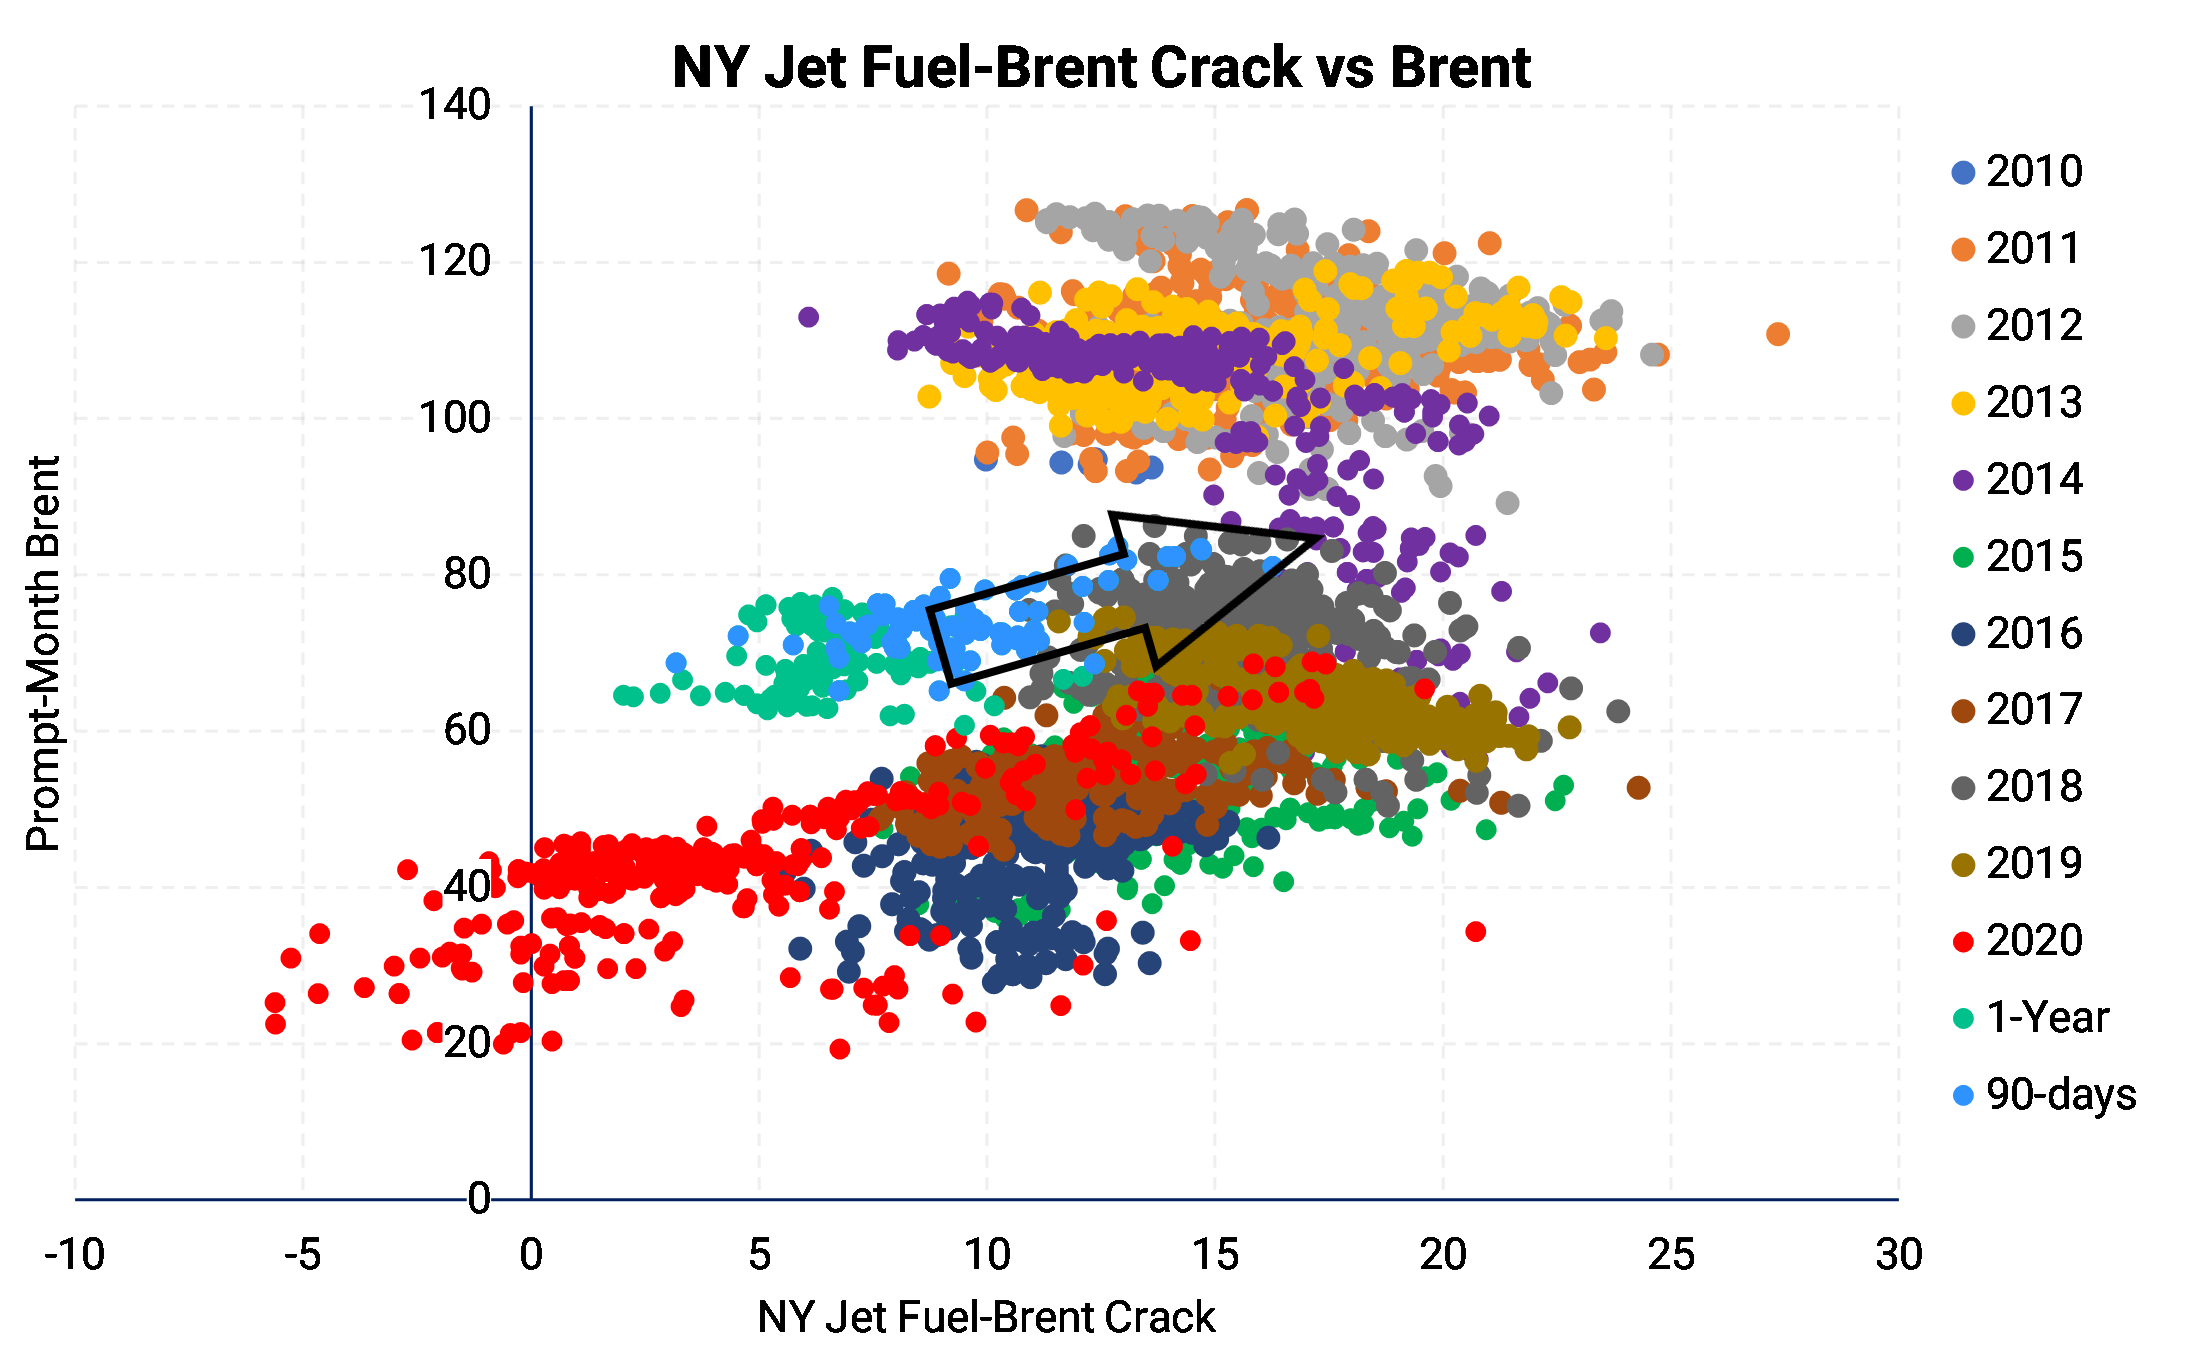
Skip ahead to October 2021, where crude oil prices are escalating AND demand for distillate fuels – jet and diesel – are recovering.
The chart below shows (see the light blue dots) that both the crack and the crude are moving higher. In addition, the trend is up and to the right – a movement that would create higher jet prices if continued.
The following discussion is from the U.S. Energy Short-Term Energy Outlook (STEO) and announcements made by OPEC+.
AEGIS adjusted the STEO by assuming U.S. oil production would remain consistent in 2022. However, this is an unlikely outcome; total oil includes natural gas liquids (propane, butane, others) rather than only crude oil.
But if the U.S. does not grow, then OPEC+’s plans to bring back all its spare capacity by late 2022 may not be enough supply to meet demand.
For this analysis, we assume that if the U.S. does not take more global market share in 2022, then share would likely go to OPEC+ in the form of higher potential production.
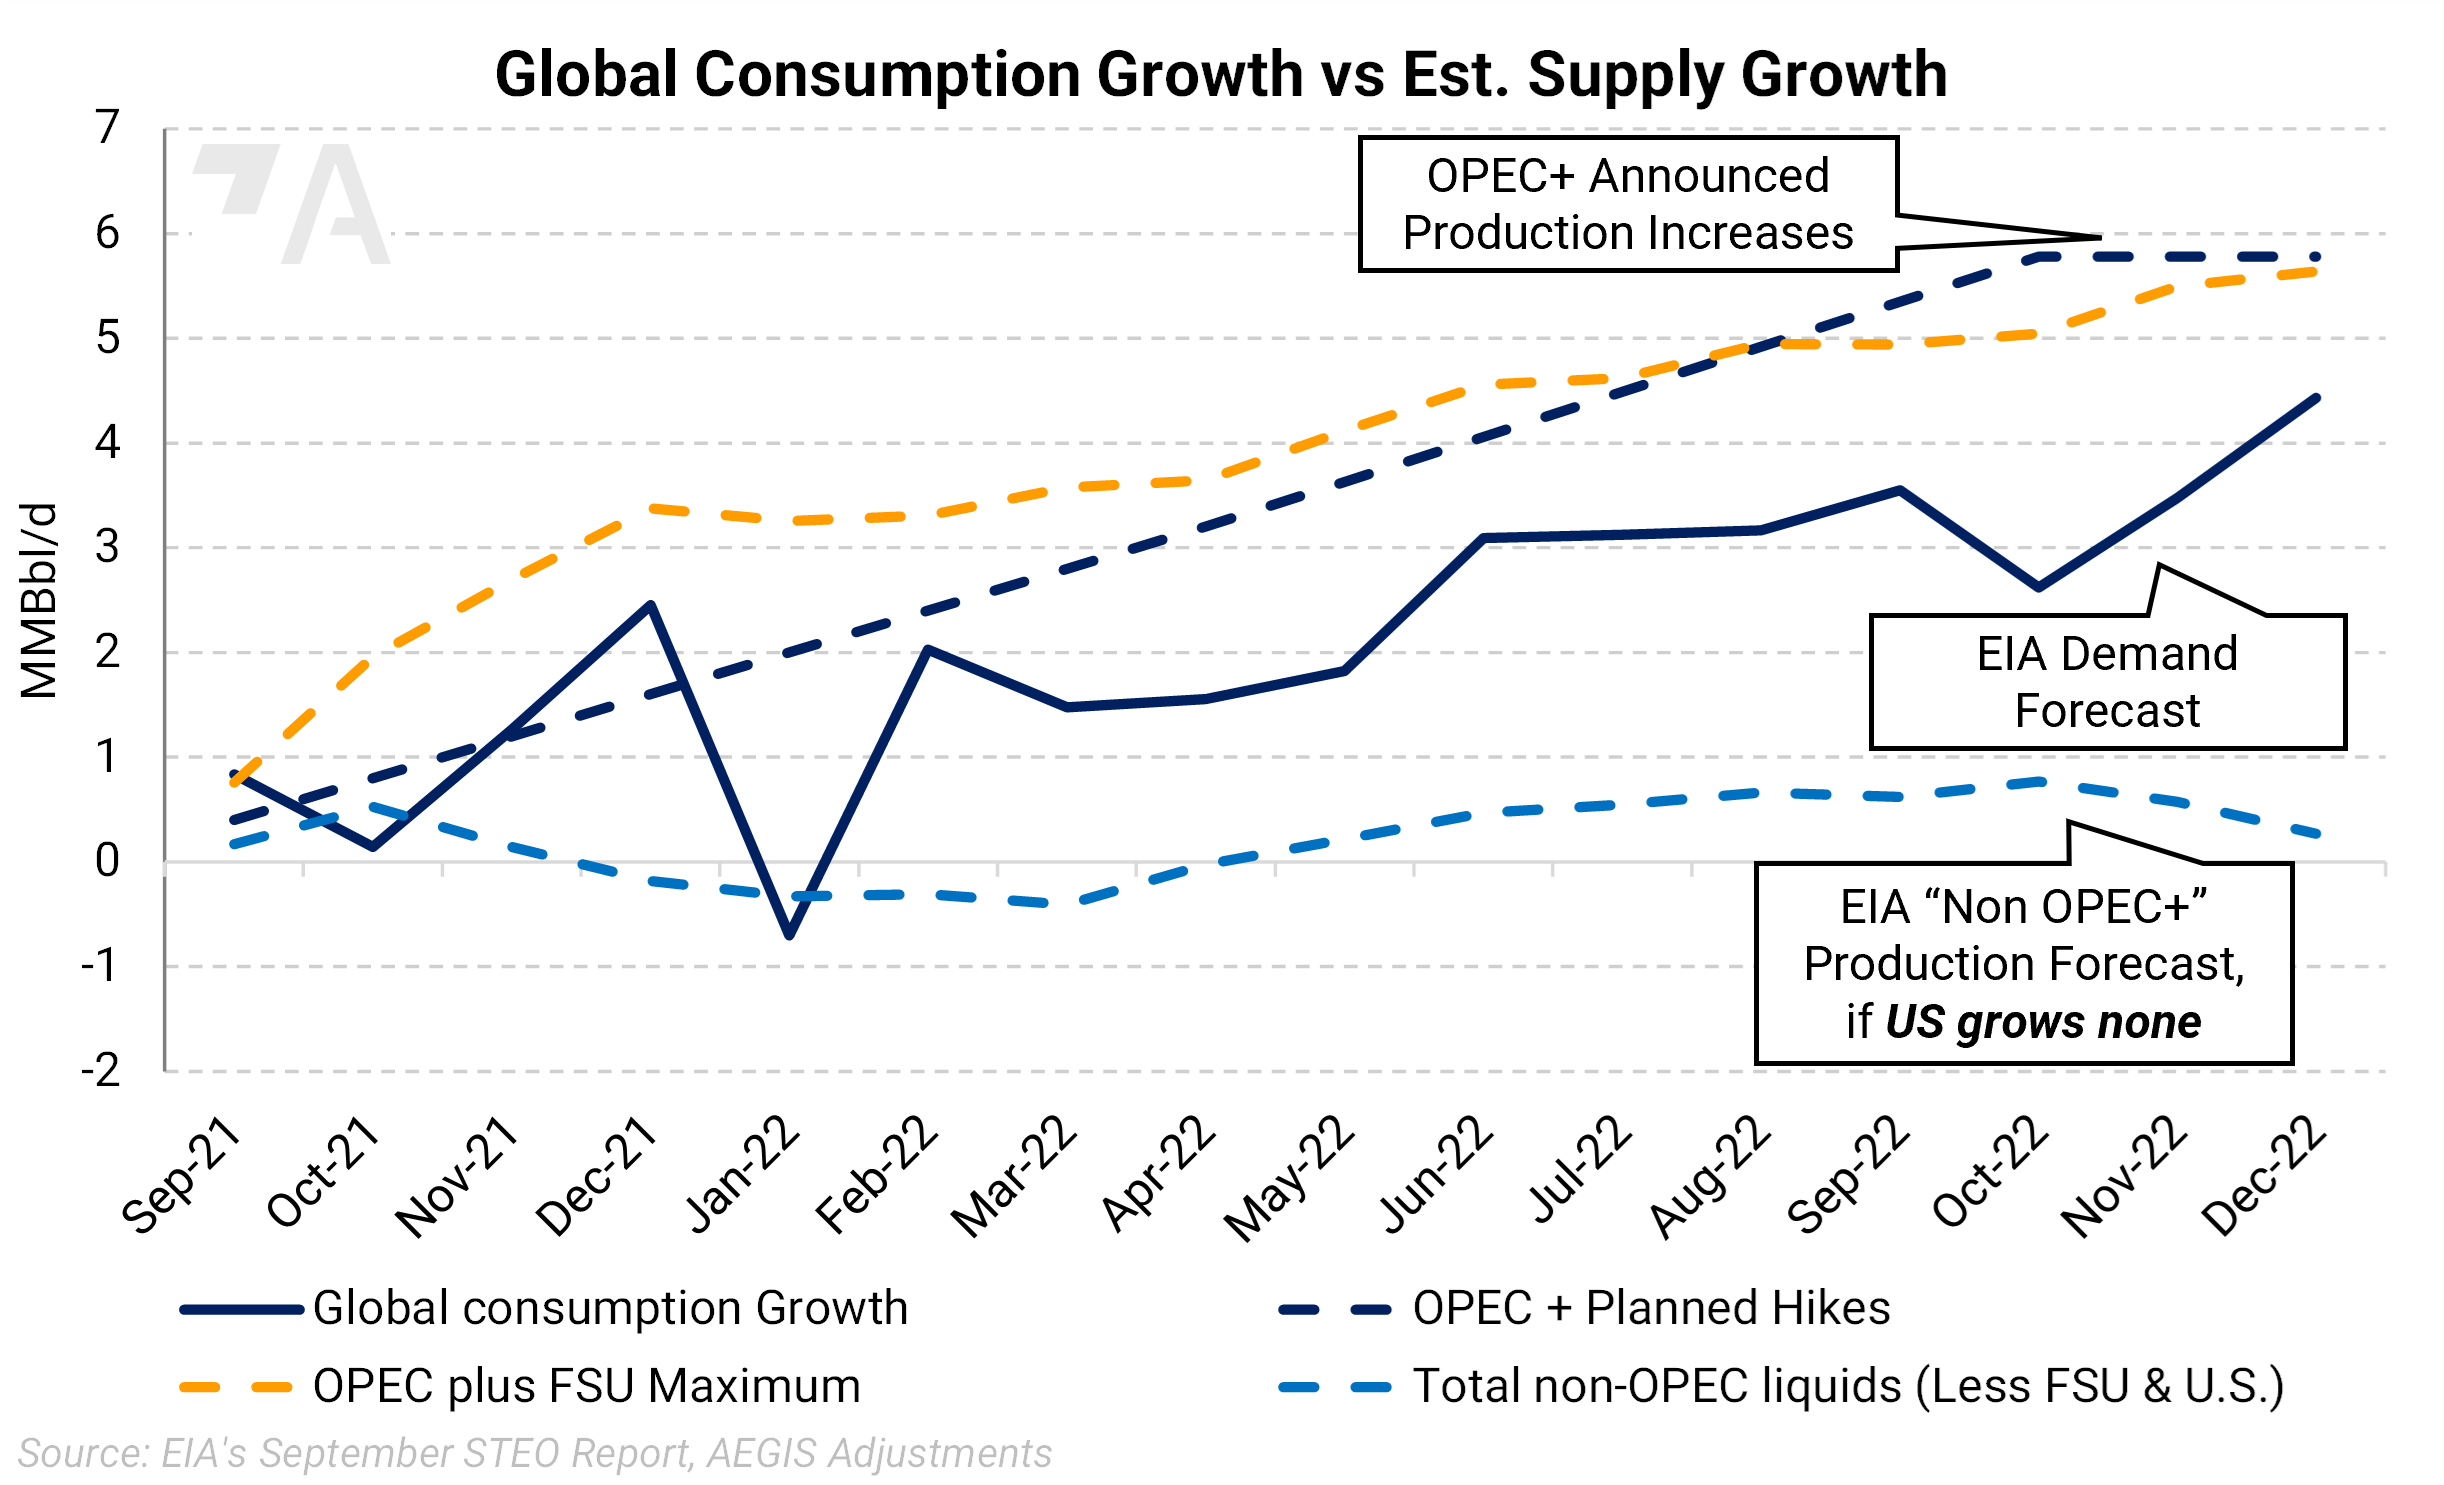
In fact, the STEO assumes a less demand growth than do many analysts, including some from respected banks, such as Goldman Sachs. Thus, as many analysts expect, the STEO forecast may be anchored to the disappointing demand-growth rate in 2021rather than a full recovery of transportation.
Therefore, if the U.S. does not grow production in 2022, the market may be depending on OPEC+ supply to avoid a shortage of oil.
Fortunately, the consumer of fuels has several choices to hedge jet or diesel:
These markets are well developed and routinely hedged by consumers and producers alike.
Although there are plenty of ways oil and fuel prices could drop in 2022, there are very acute bullish scenarios that demand attention.
AEGIS clients usually hedge directly with the fuel itself or through a reliably correlated proxy market. For example, Brent crude oil has historically worked well, however, there are risks. AEGIS analytical tools and strategists can help measure your exposures to fuel prices and design a hedging policy and execution plan that work with your tolerance for price risk.
Could jet and diesel impact your bottom line? Let’s talk.