Whenever there is a shift to a high or low-price environment, it tends to persist for a while. In history, neither has been permanent. The pain of being unprepared for a sudden decrease in price can be more than just an inconvenience. It can destroy company value.
Historical WTI Futures
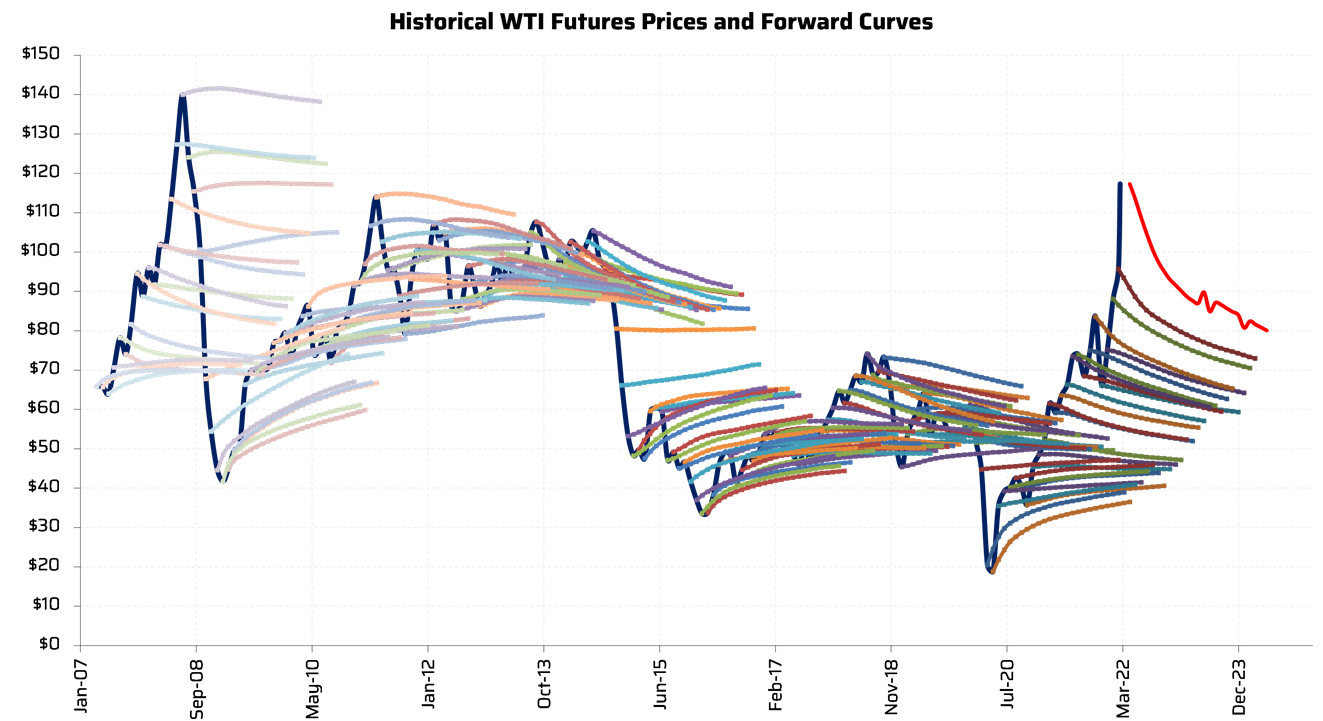
- The chart shows the forward curves at the end of each month for WTI going back to 2007
- The forward curves are a negotiation of future prices but have been terrible forecasts of future prices
- The forward curves are the pricing at which AEGIS clients can hedge, lock-in, or set a floor price for their future
- At any one of these historical curves, the hedger had the choice of locking in those prices or waiting and not hedging
Benefits of considering hedging when the prices are higher
Put Options
- When prices rise, put options at lower strikes (floor prices) usually become less expensive
- Implied volatility in the options market may rise (and has recently) resulting in put options premiums generally increasing.
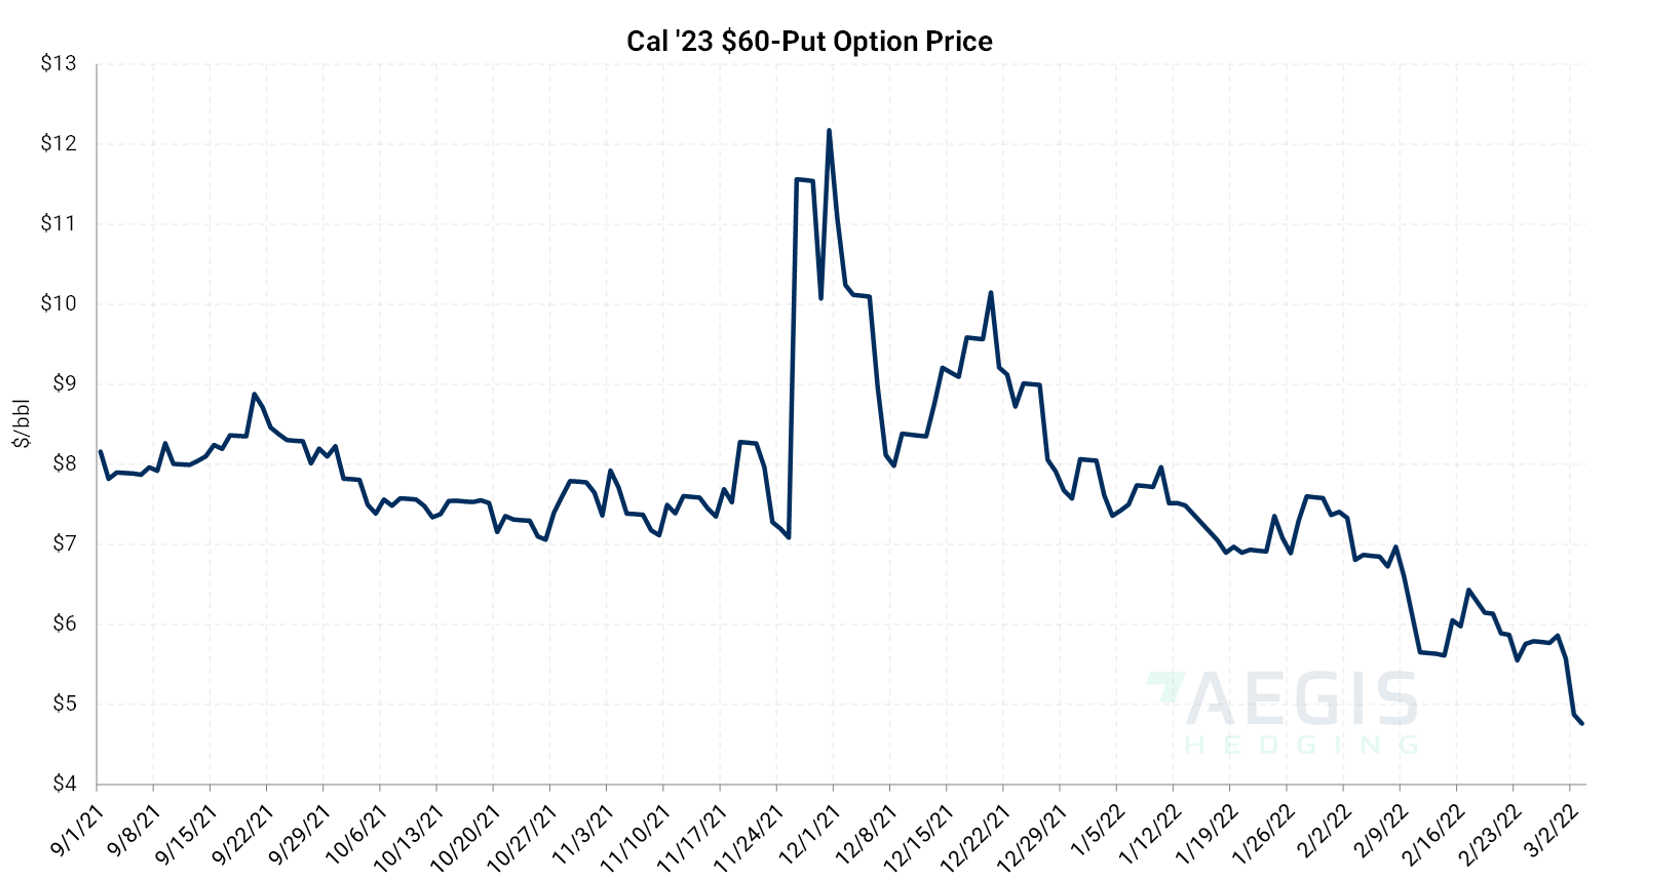
- However, when the underlying oil price rises, a put of a certain strike and tenor (e.g. a $60 floor for all of 2023) usually becomes cheaper
- The chart shows the cost of a $60 per barrel put option, or a floor price, for 2023. It would effectively set a minimum price for the oil for barrels hedged this way.
- In September 2021, this put option price was $8/bbl, but it recently dipped to under $5/bbl
- Not only has this put option become less expensive, but the cash used to buy the put option can sometimes be deferred into the future. This means the cash paid for the put option would more closely match the timing of cash received for oil sold.
Costless Collar
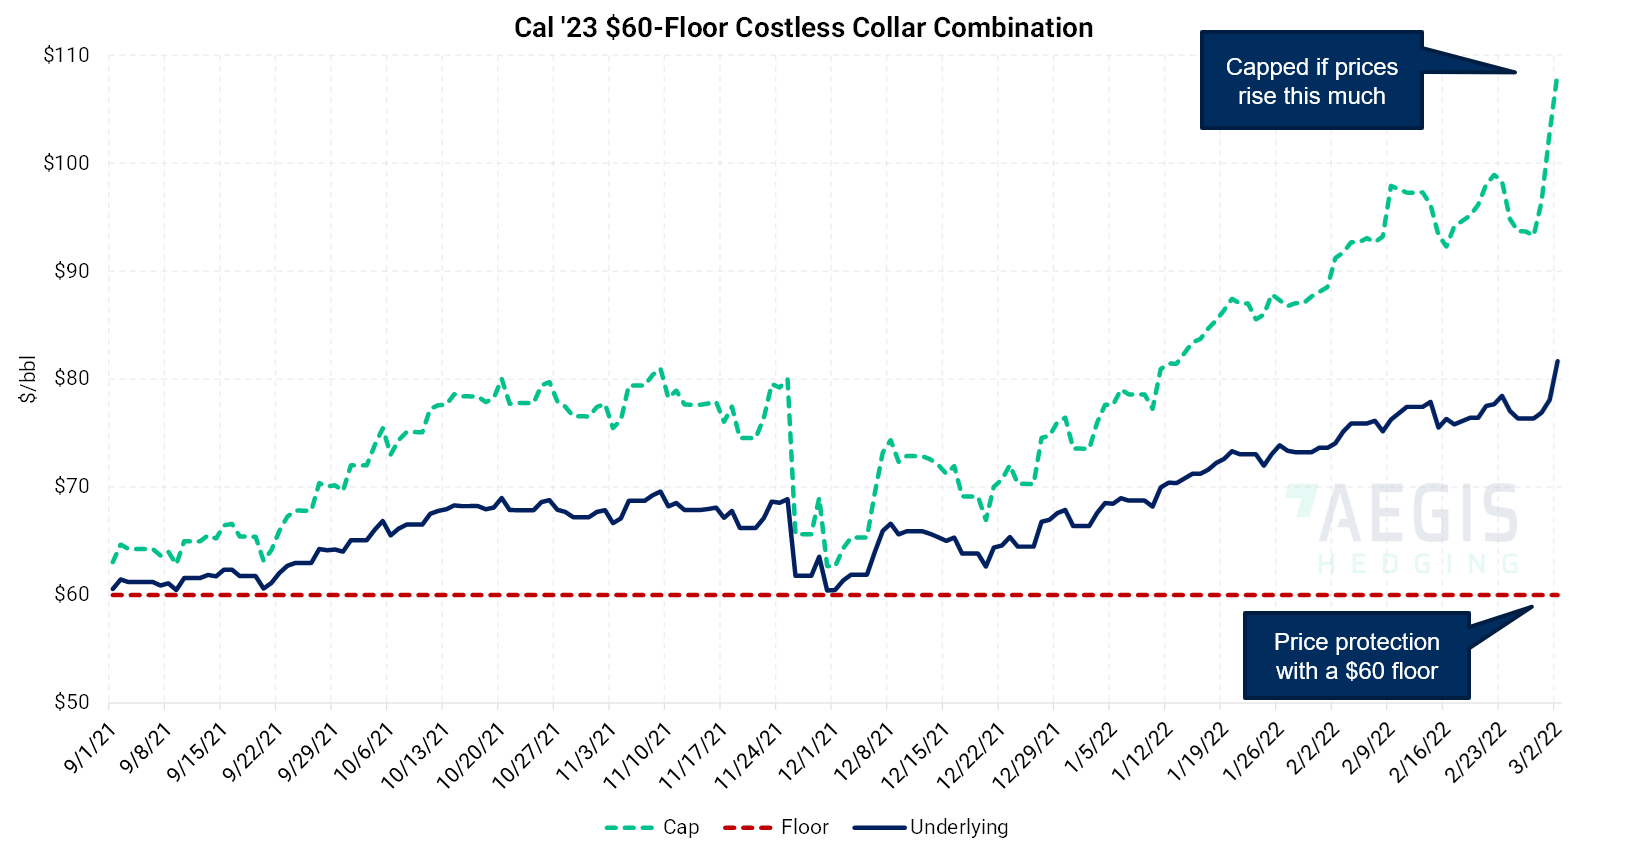
- As prices rise, a costless collar can become more attractive, because the same downside protection (floor) is available with more upside participation (higher cap, ceiling, or call strike)
- A costless collar is buying a put option and selling a call option, which results in a minimum floor price and a maximum ceiling or cap price. The strikes are calculated so that the put option’s premium paid is exactly the call option premium received.
- The chart depicts what your price cap would be if you chose a $60 floor. The "Underlying" is the average future oil price for the year 2023
- As the underlying price of oil increased, the cost of the put option decreased, and as it gets cheaper, you don’t have to give up as much upside. This results in a wider costless collar with a higher and more beneficial ceiling
- The “width” of the collar is the distance between the cap and floor. Sometimes, the demand side of the market becomes concerned as prices rise and purchases call options. These purchases further widen the costless collar, to the benefit of the producer wishing to hedge.
- That has, fortunately, been the case recently
An example of real costless collars executed for our clients on March 9
- Please contact AEGIS for updated costless-collar pricing if you are considering this type of hedge. They change many times per day, especially considering recent oil-price volatility.
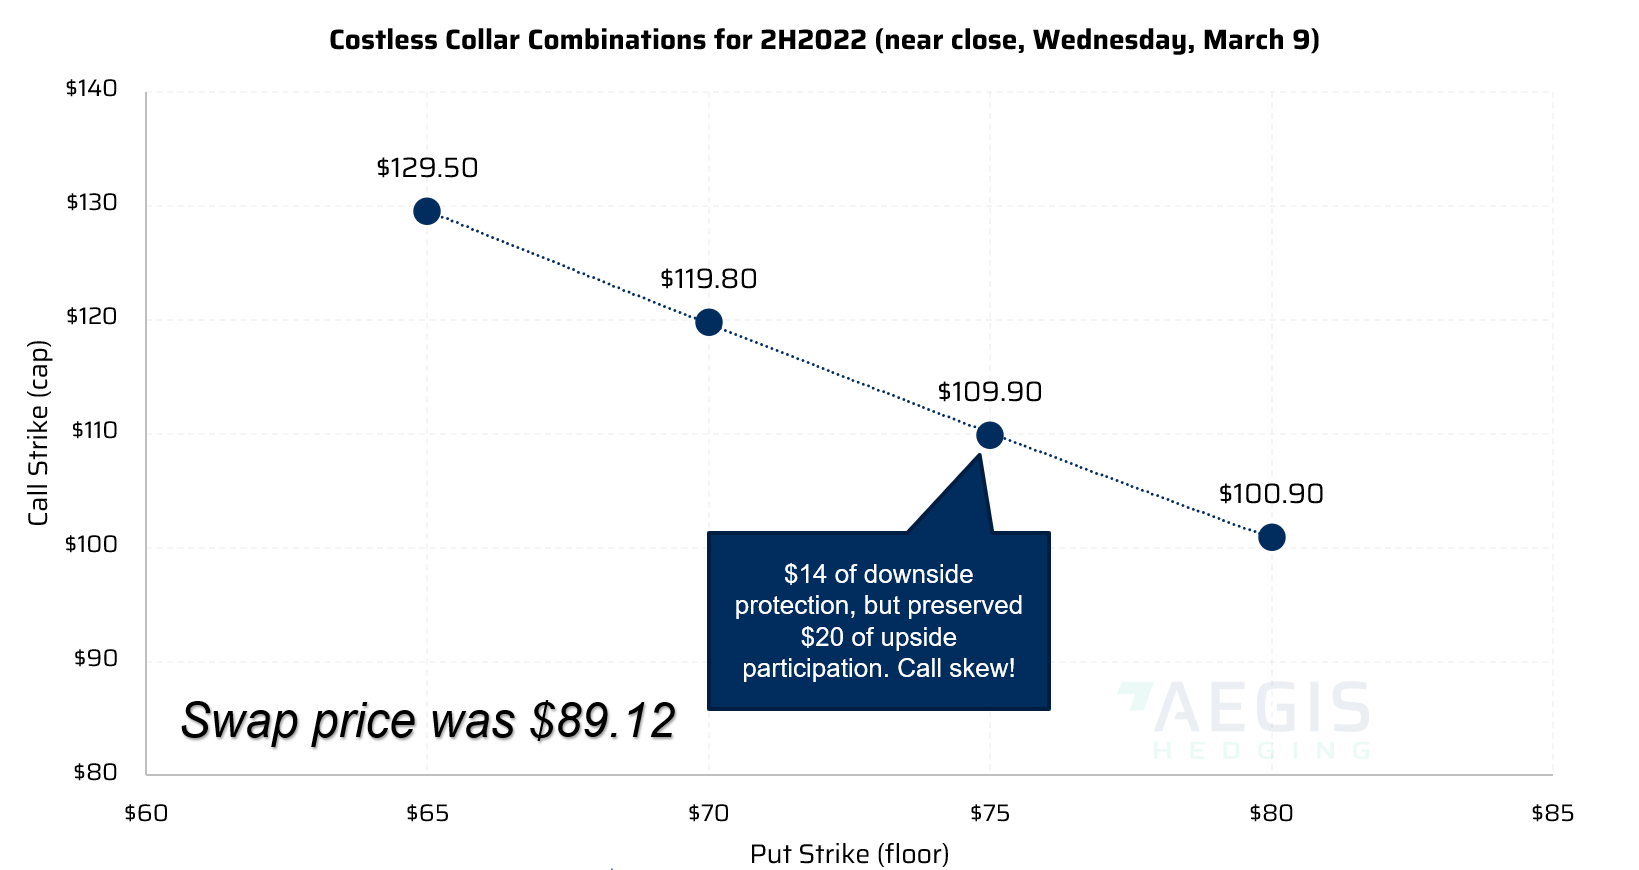
- In the chart above, the tenor for the costless collars was the second half of 2022, on March 9, when the WTI CMA price was $89.12/bbl
- The chart shows the combination of put option and call option strikes that made up costless collars. At $65 and $70 put strikes, caps of $129.50 and $119.80, respectively, were achievable for many
- To keep the collar costless, you give up more upside when you choose more protection with a higher floor
- “Call skew” can be a great benefit to an oil-producer hedger. Consider the combination where a $75 floor allows you to be capped at $109.90. The swap price was $89.12. You would have only had to tolerate $14 of downside before being protected by the put option. Meanwhile, you would not be capped until $109.90. That’s $20 of upside exposure compared to $14 of downside exposure.
- Call skew is uncommon in the oil market, and we encourage oil hedgers to consider them as part of a hedge portfolio.
If you have any questions about hedging, please contact our trading representatives. They’re more than happy to walk you through this.
Crude Oil Fundamentals
In our webcast, we discussed several scenarios – combinations of future events where supply, demand, and inventory changes could translate into higher and/or lower prices.
OPEC+ Production
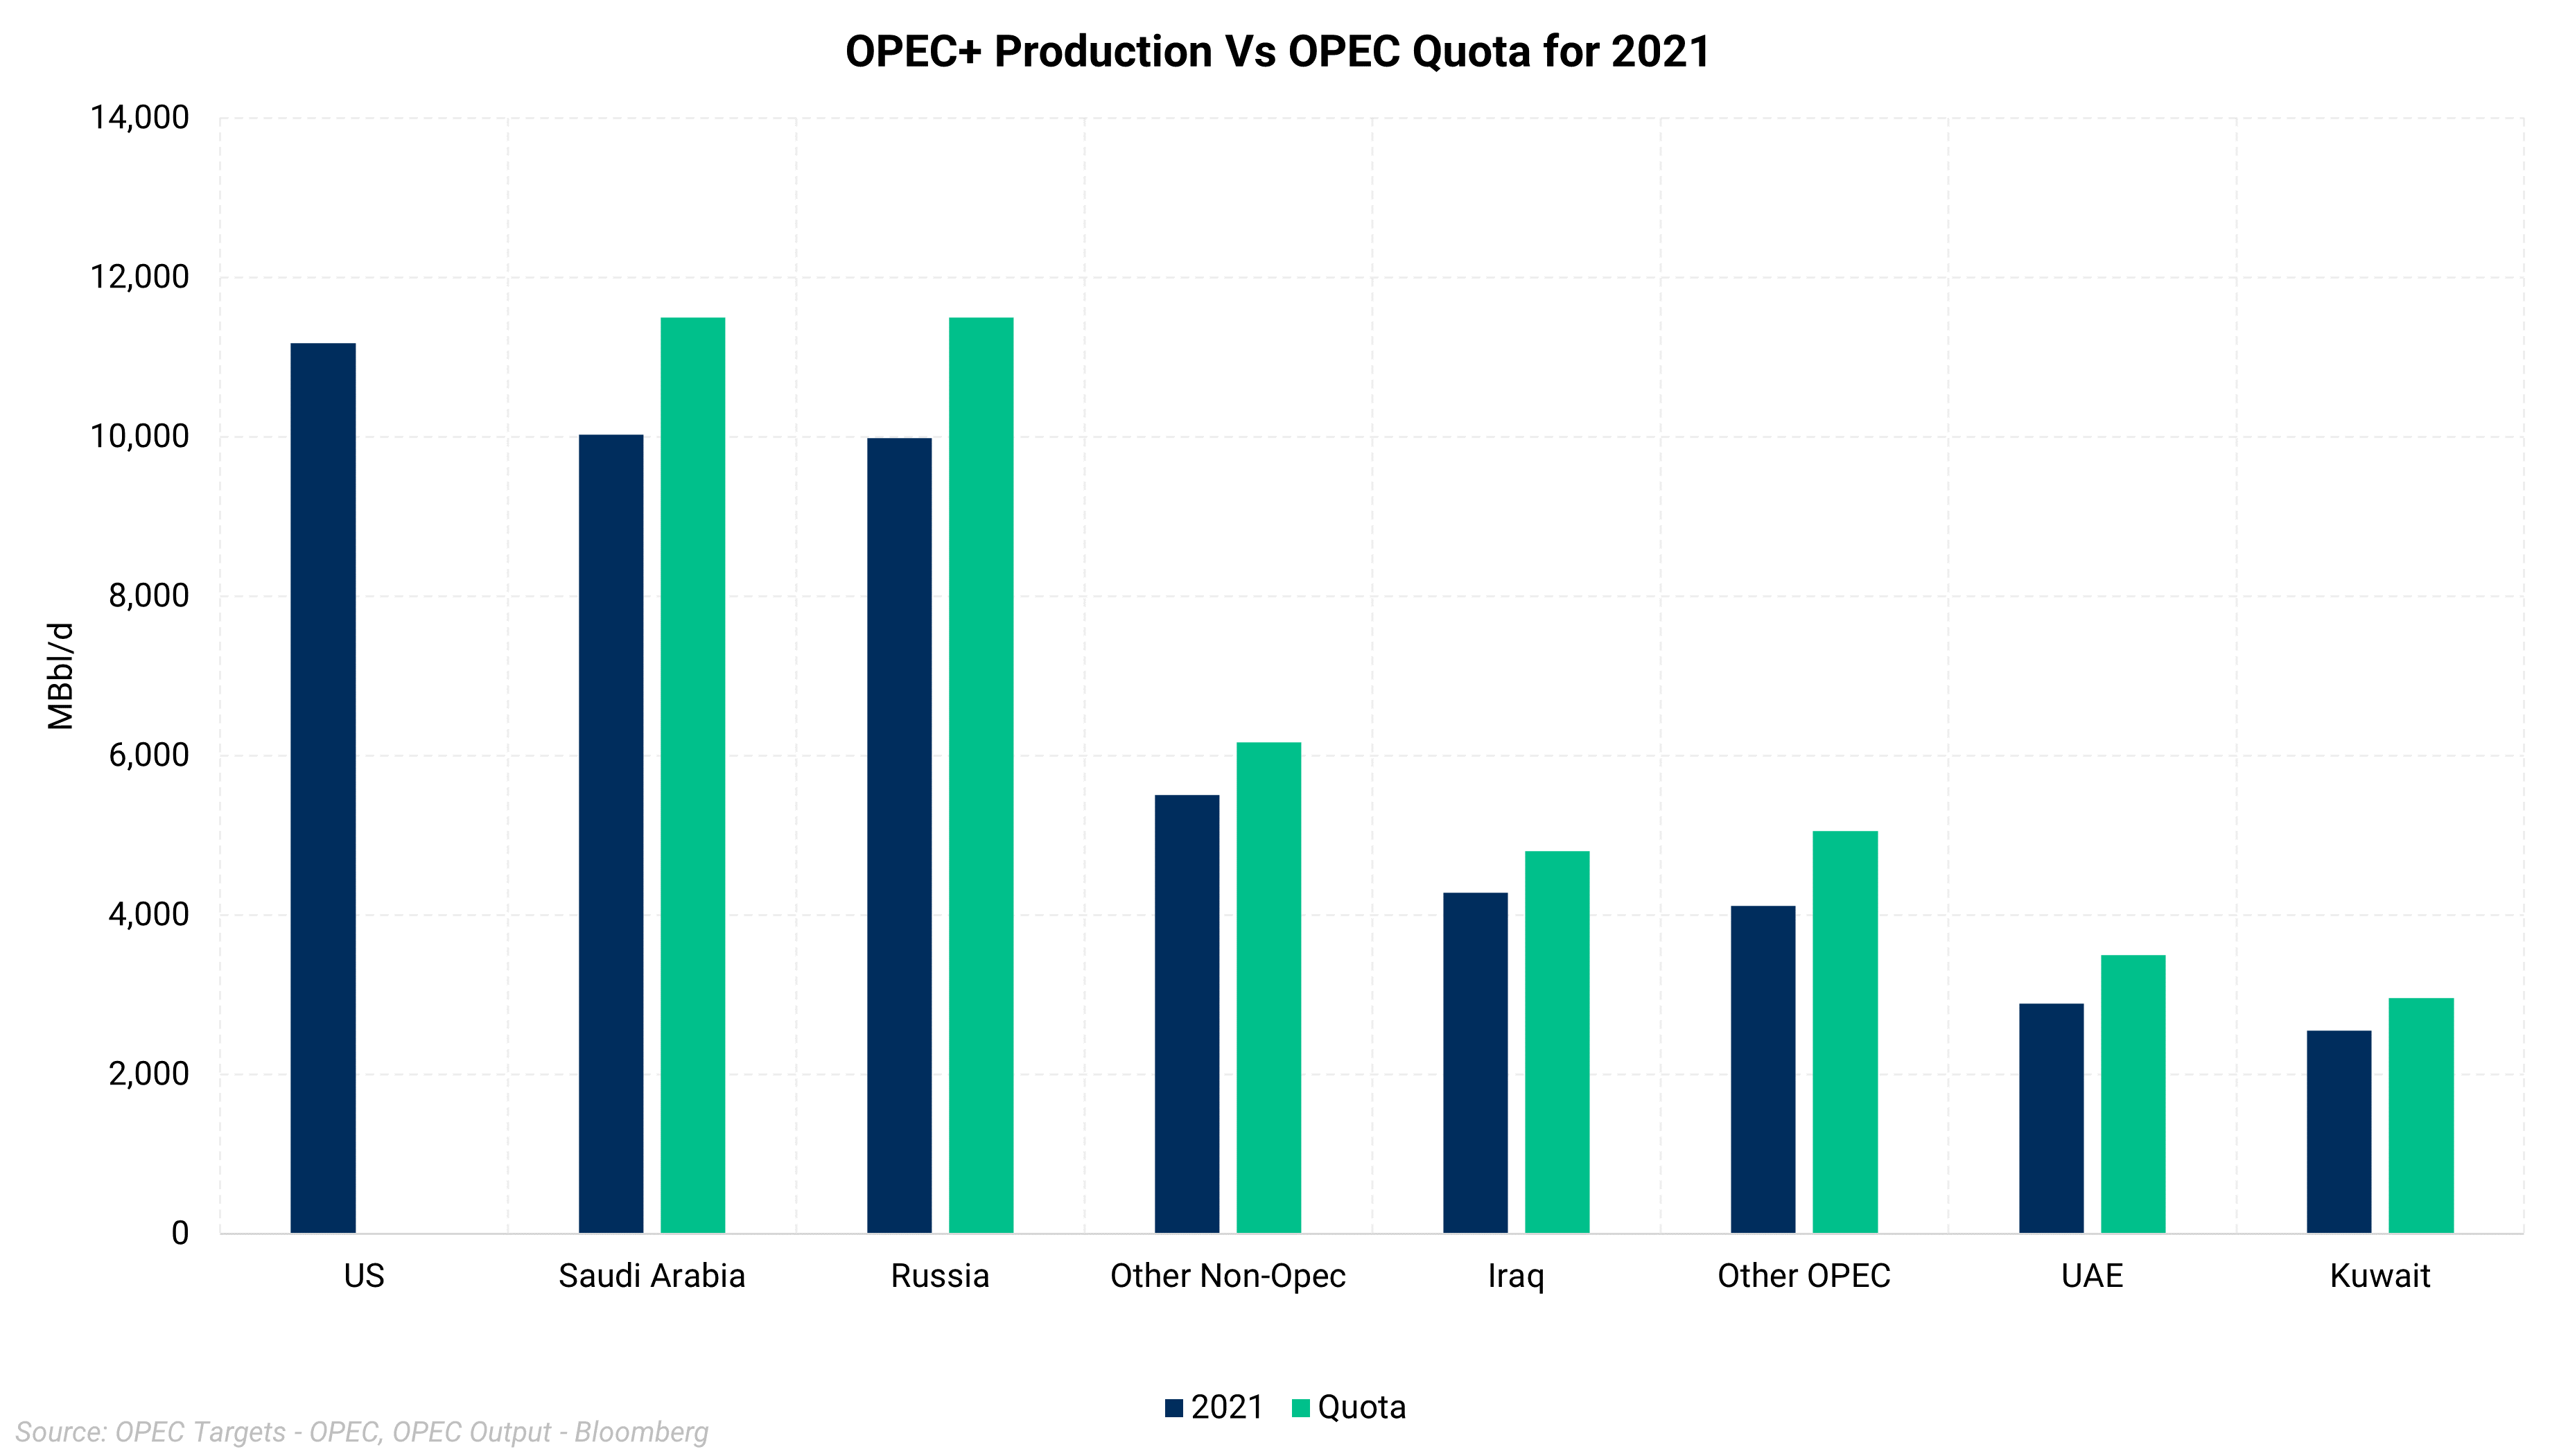
- U.S., Russia, and Saudi Arabia constitute around a third of the world’s production capacity
- Russia and Saudi are holding back on production due to their agreement with the OPEC+ committee
- OPEC, and later Russia, helped stabilize prices since they began rationing supply in 2017.
Russian Exports
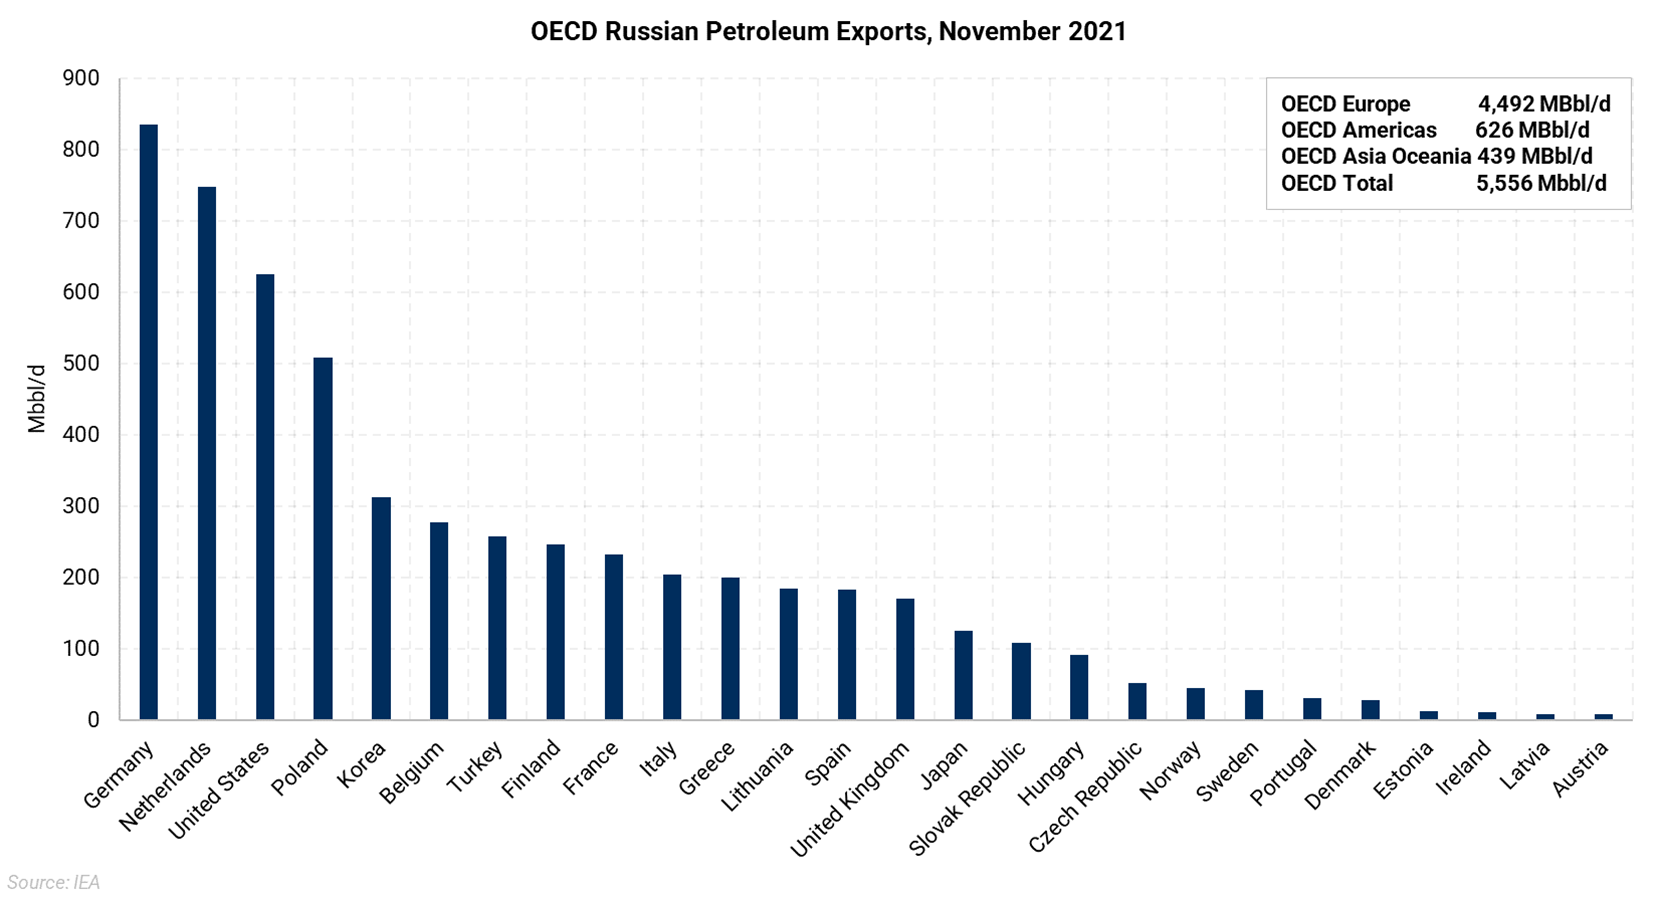
- Russia exports about half of its oil to the OECD countries
- The chart shows the total petroleum exported by Russia in November 2021
- The U.S. is third on the list of OECD importers, and this doesn’t include China and India
U.S. Imports of Russian Products
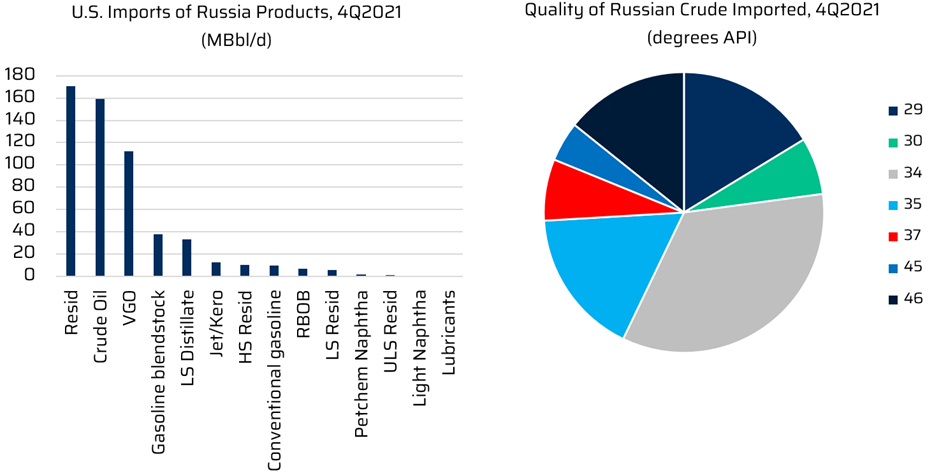
- The US imported more semi-refined products such as residuum and VGO than crude oil from Russia in 4Q21
- Volumes totaled less than 450 MBbl/d in 4Q21, and replacing Russian imports would be manageable (Since our webcast, the US has suspended Russian oil and gas imports)
- The pie chart displays that the majority of the Russian crude imported was medium grade.
Iran Production and Exports
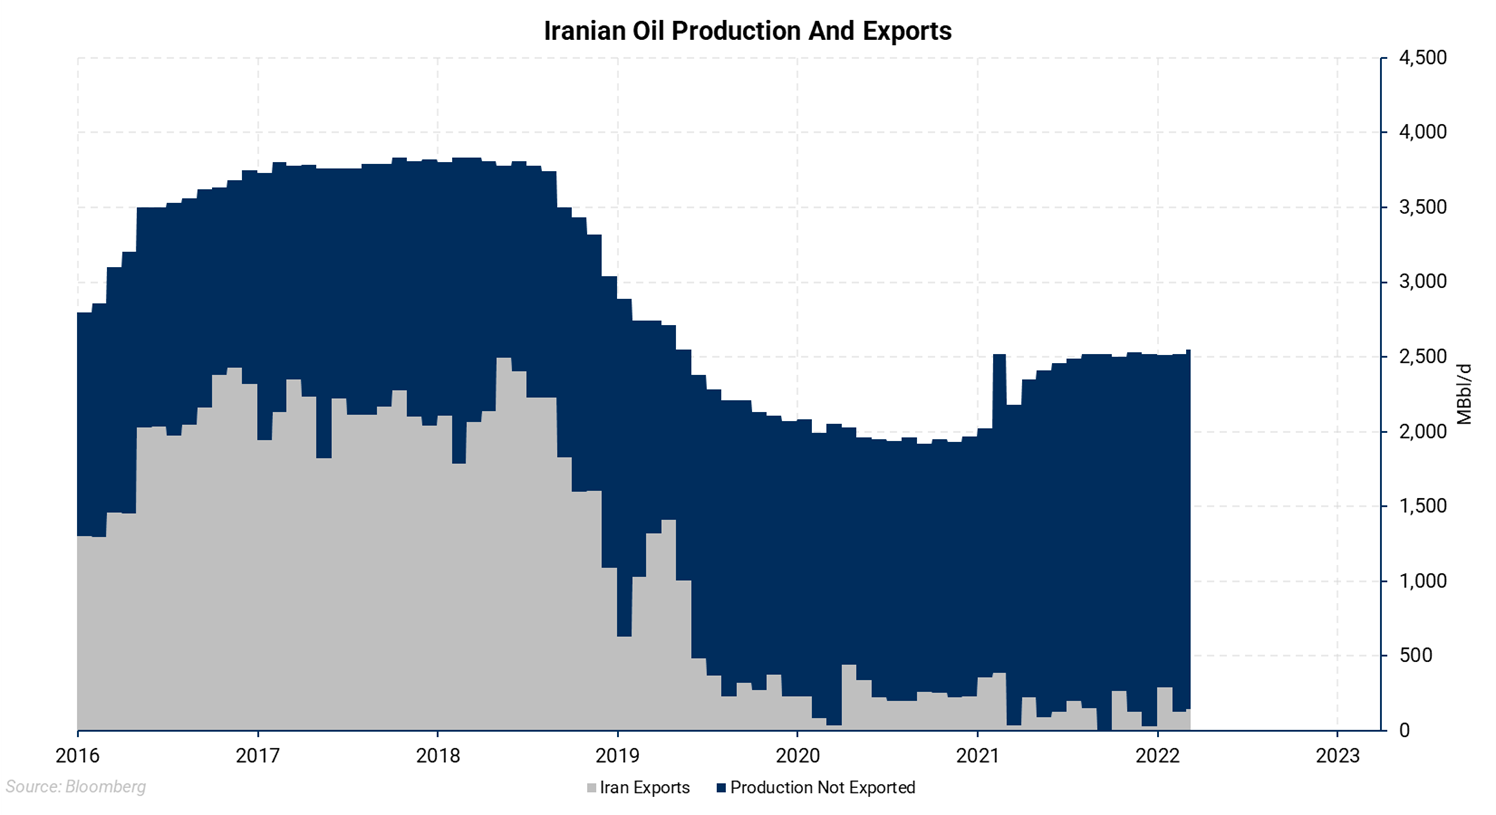
- Iran has oil in floating storage and likely has production it could return to the market, if US sanctions end
- Iran reports production of around 2.5 MMBbl/d, down from 4.0 MMBbl/d. But these volumes may not be completely accurate as they might not be disclosing the correct production numbers
- Doubtful if they might achieve the 4.0 MMBbl/d now
- Beyond the production numbers, it is reported that they have floating oil storage of around 100 million barrels
- This would translate to 1 – 1.5 MMBbl/d for 100 days and their ongoing production of 2 – 2.5 MMBbl/d of exports
SPR Release
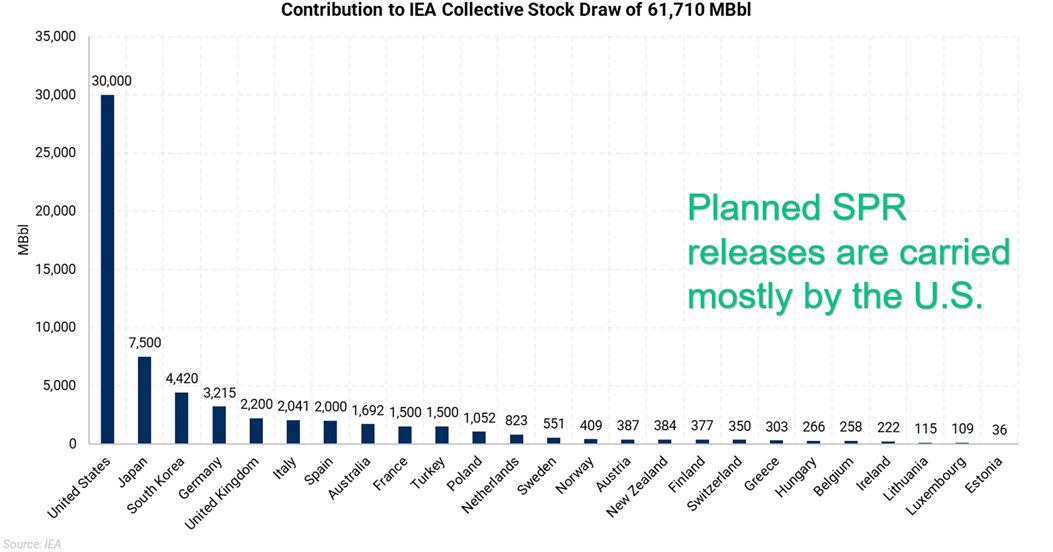
- The SPR release is an immediate source of supply
- A total of a little over 60 MMBbl was announced to be released by the OECD countries, with the U.S. committing to 30 MMBbl
- If they released 60 MMBbl over 60 days, it is 1 MMBbl/d of supply
- It does take away some emergency barrels that could have been used in the future
Days of Working Inventory
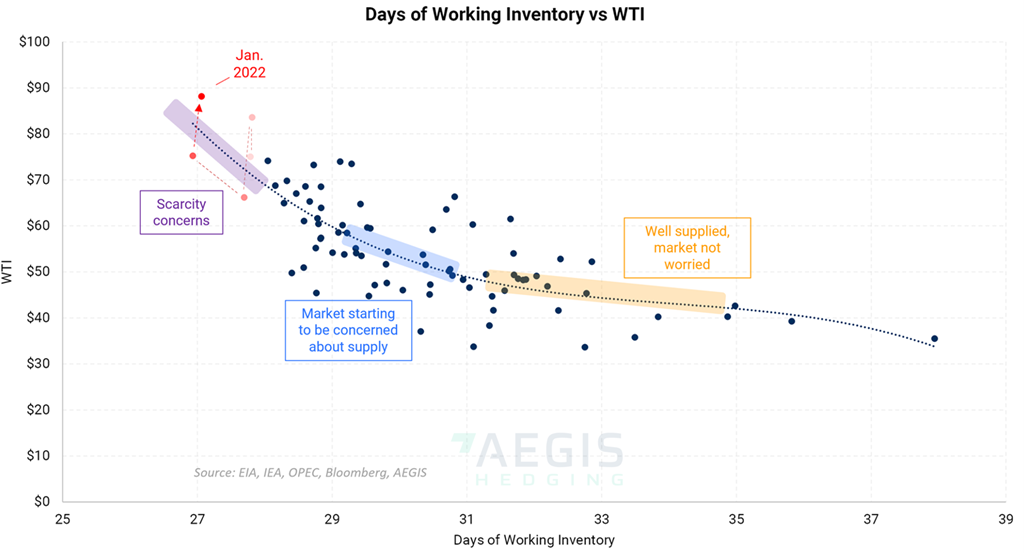
- Inventories are a useful economic measure, but they should be adjusted to account for demand growth. The chart above compares inventories and demand. Take the total petroleum stocks of OECD and divide by the global demand
- This is a measure of buffer inventory that is meant to mitigate supply disruptions
- It is related to price because it is essentially a supply-demand measure; the lower the number of days, the more insufficient net supply
- It goes parabolic at around 29 days, and we are concerned that it has been moving upwards on the curve
- This can change if the right set of events occurs, like supply from Iran, emergency barrels from OPEC, or a cease-fire
Oil Expense Indicator
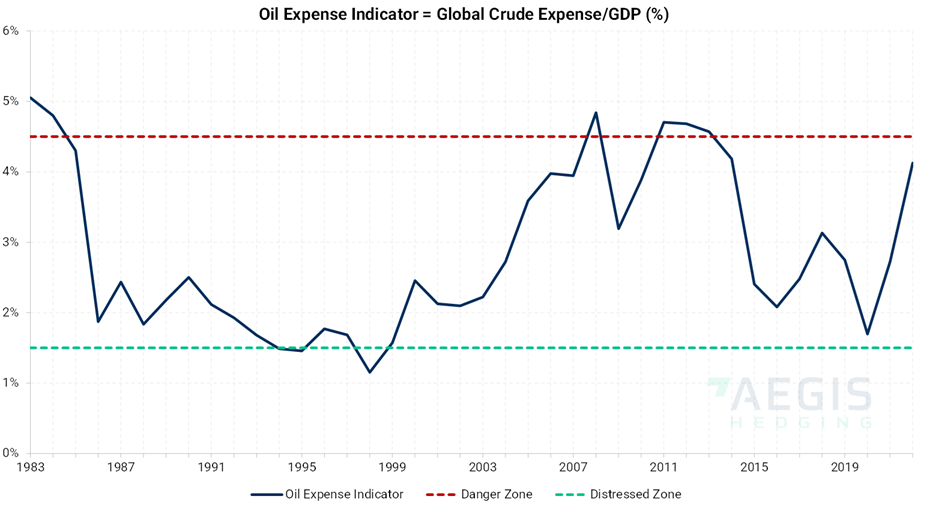
- The chart shows how much money has been spent on crude oil internationally, compared to the size of the global economy
- In 2008, the expense hit a high point. Many analysts believe that rising energy budgets contributed to the subprime crisis and the Great Recession of late 2008-2009.
- The answer to the question” If oil goes higher, is it going to destroy demand?” is Yes, but by how much?
- Two scenarios can be considered
- Simple demand destruction where people consume less energy because the prices are high
- The second scenario is when the global economy stalls and shrinks in some countries (recession), resulting in less demand for energy due to the economy faltering
Combination of events that translate into prices
Higher Prices
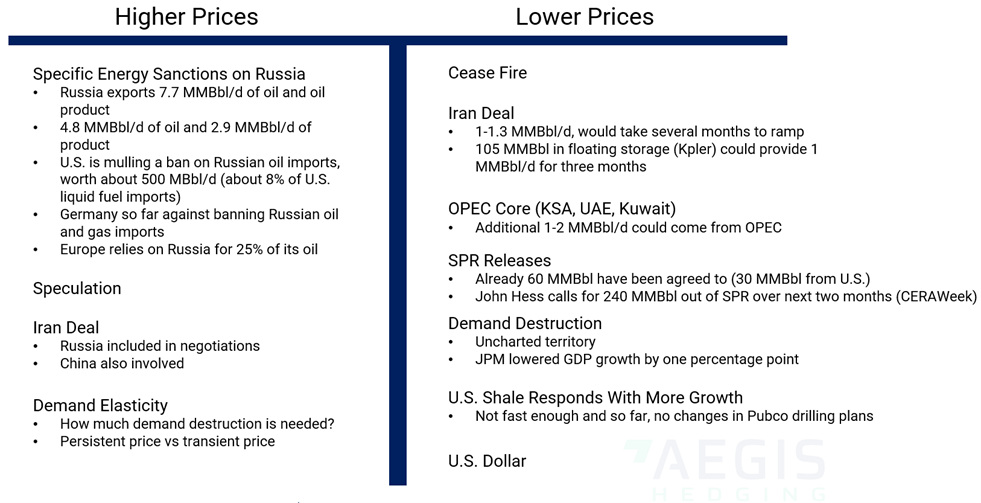
- The bullish factors that can align to push for higher prices are specific energy sanctions on Russia by several countries, the Iran deal falling in place, and demand elasticity.
- Massive sanctions on Russian petroleum exports totaling around 8 MMBbl/d will disrupt the world supply. To balance the market, alternate sources of supply need to be utilized, such as OPEC, Iran, SPR, etc
- U.S. is planning on sanctioning Russian energy exports, whereas the EU is split on the decision
- Both Russia and China are involved in the Iran deal, giving them leverage to affect the prices
- For demand elasticity, if a certain number of Russian barrels are replaced from OPEC or Iran or SPR, how many more additional supply barrels are needed to match by destroying demand
Lower Prices
- A Russia-Ukraine cease-fire would set the supply-demand balance closer to normal, and price premiums caused by geopolitical uncertainty would decrease
- Sources of alternate supply are limited
- Iran’s storage and production together would act to send oil prices lower
- Potential OPEC ramp-up in production
- An expansion of the planned SPR release of 60 MMBbl
- Demand destruction and damage to the economy are a possible result of higher oil prices. Escalation of raw input costs leads the inflation resulting in cutting down economic growth
- A chance of the U.S. increasing production against potential roadblocks such as supply chain issues
- The U.S. Dollar got stronger as the conflict broke out. It is purchasing power parity holding back the oil prices
Factor Matrix – Crude Oil
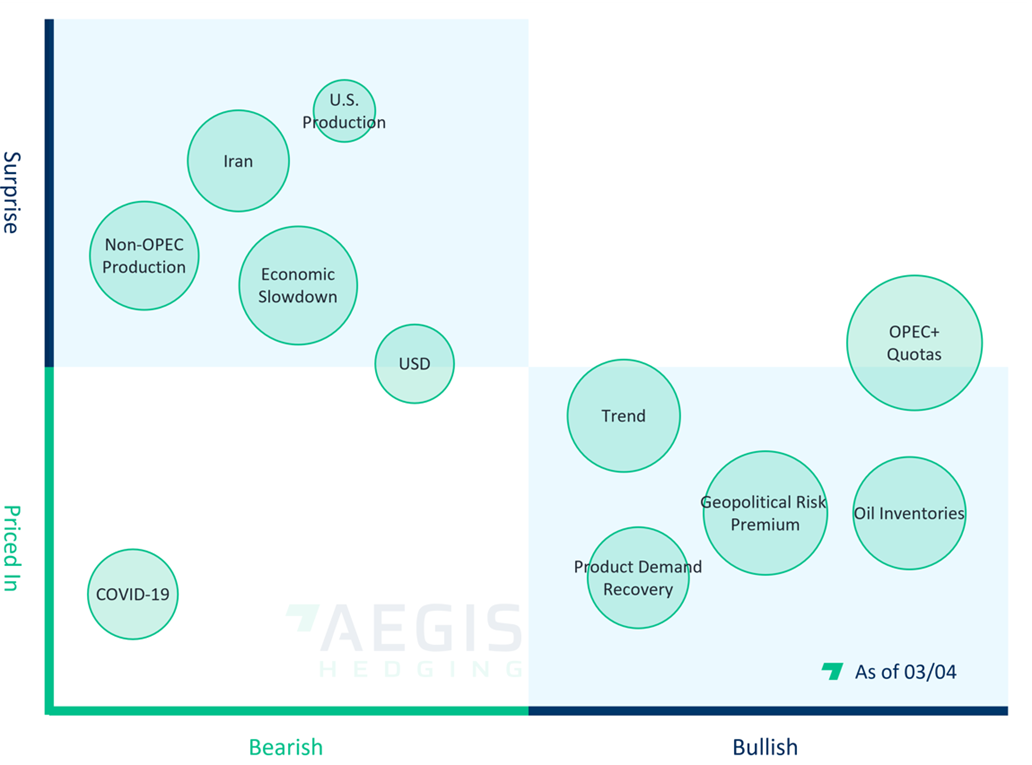
- The Factor Matrix is a three-dimensional version of the T-chart we just saw. Potential bullish and bearish variables are also priced in
- Some of these, such as the geopolitical risk premium, product demand, and OPEC quotas, might quickly reverse
Hedging Fuels – Gasoline, Diesel
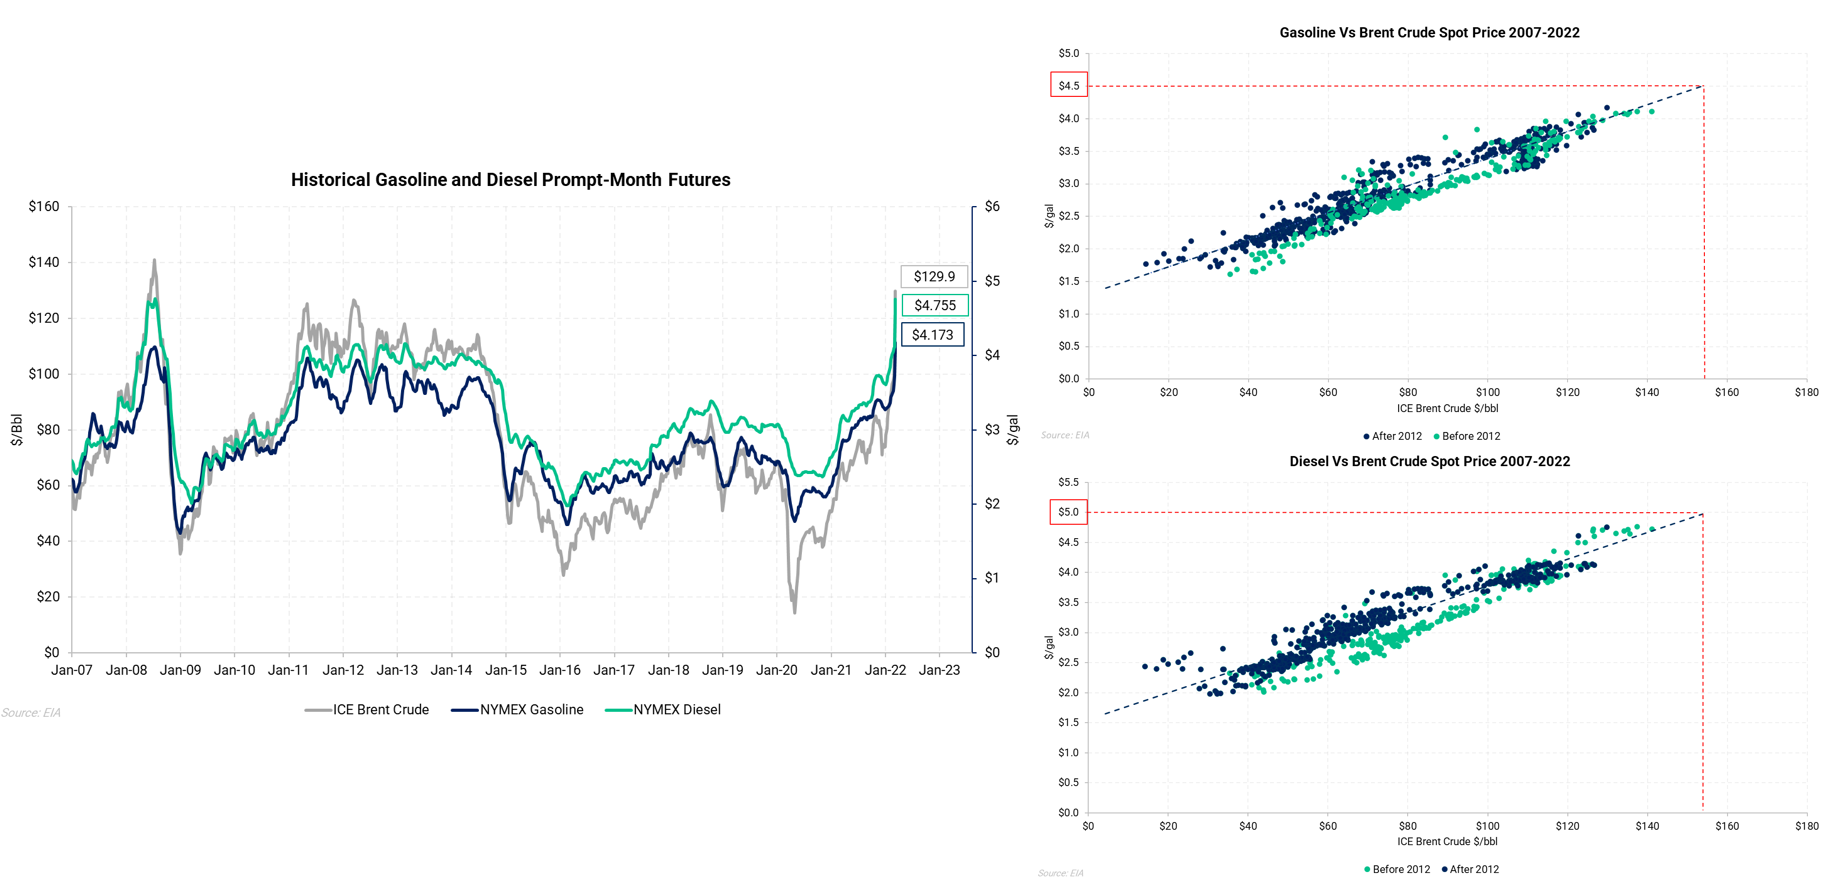
- Oil is the most important determinant in diesel and gasoline prices
- The line chart shows the historical prompt month Brent pricing compared to retail gasoline and diesel
- The scatter plots show the statistical relationship between gasoline and diesel with Brent. If this situation continues and oil prices do reach $150, you could be looking at retail prices of $4.50 gasoline and $5.00 diesel
- The good news is that you may hedge diesel and gasoline either directly (NYMEX and other contracts) or indirectly through oil (WTI or Brent)
- Caution - If you're an oil producer who spends money on diesel, your hedge isn't as simple as a pure diesel consumer’s would be. Instead of utilizing the diesel price as a hedge, you should consider using a diesel crack. If you're thinking of hedging, talk to us first
Natural Gas Fundamentals
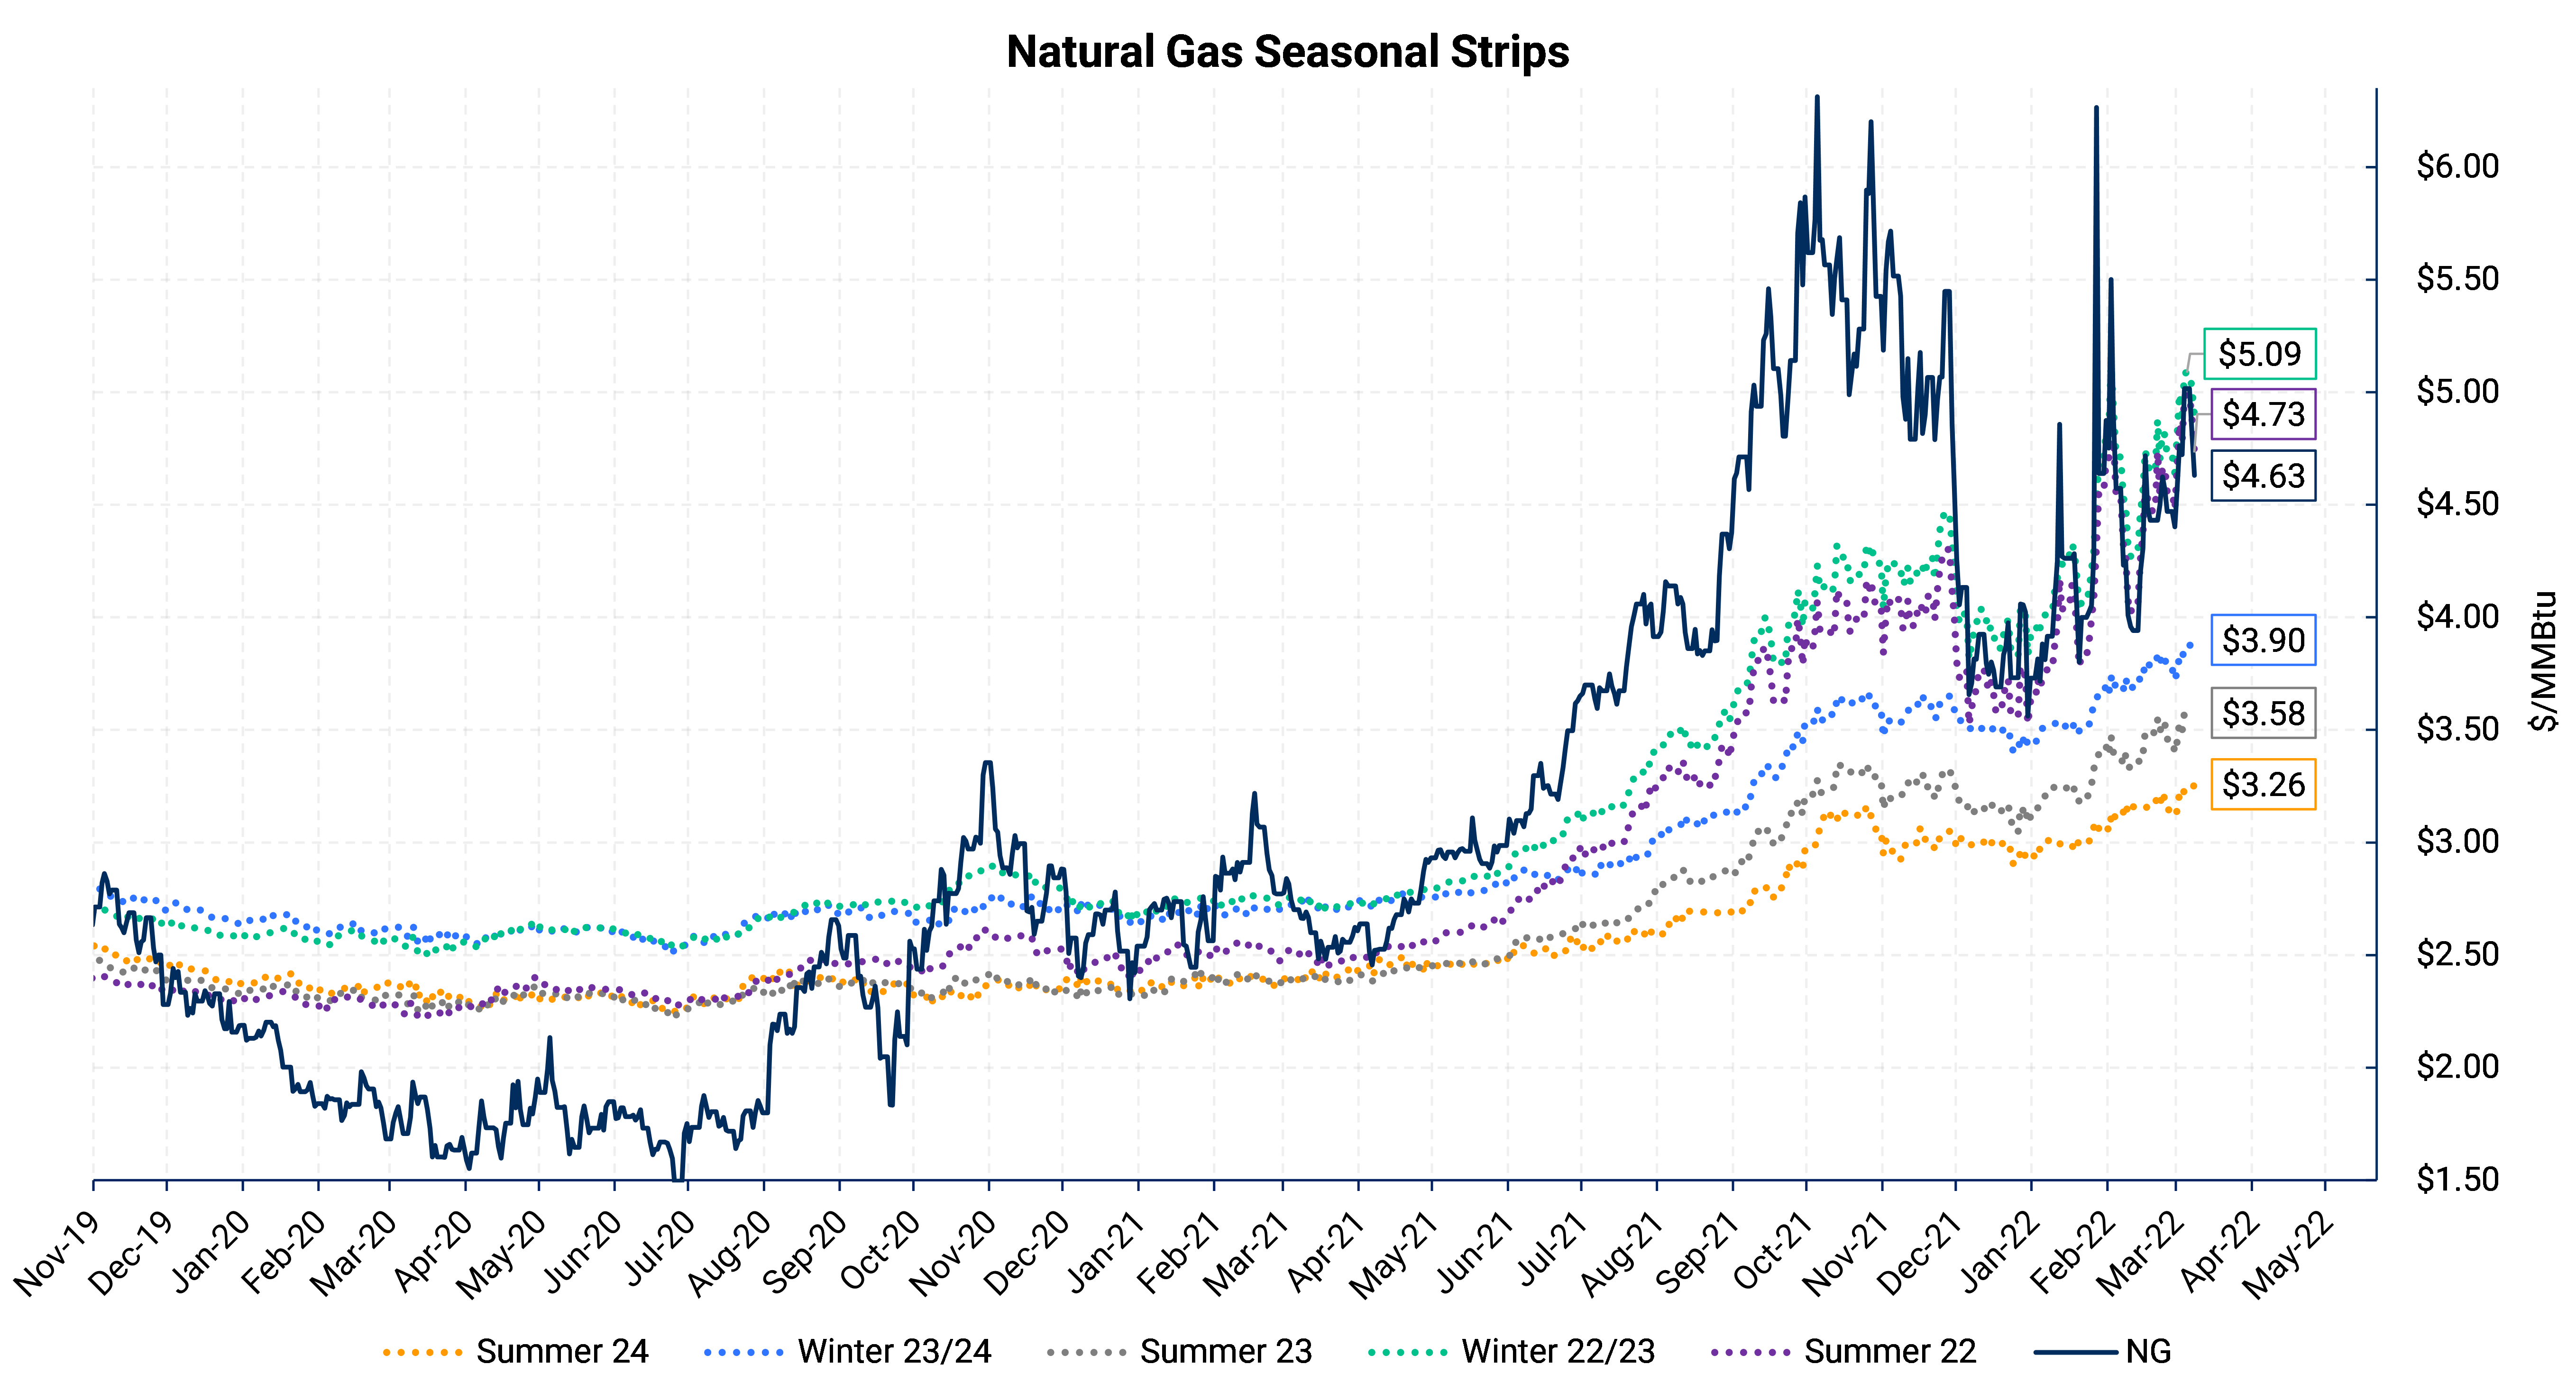
- Since January, the gas price rally was because of bullish weather and draws on inventories, not the Russian invasion
- The rise in near-term gas prices has pushed the curve higher
- Volatility is currently in the producer's favor. It's a challenging market to hedge if you're a customer. Before hedging your consumption, get in touch with us because there are risks
Cap-Floor Index
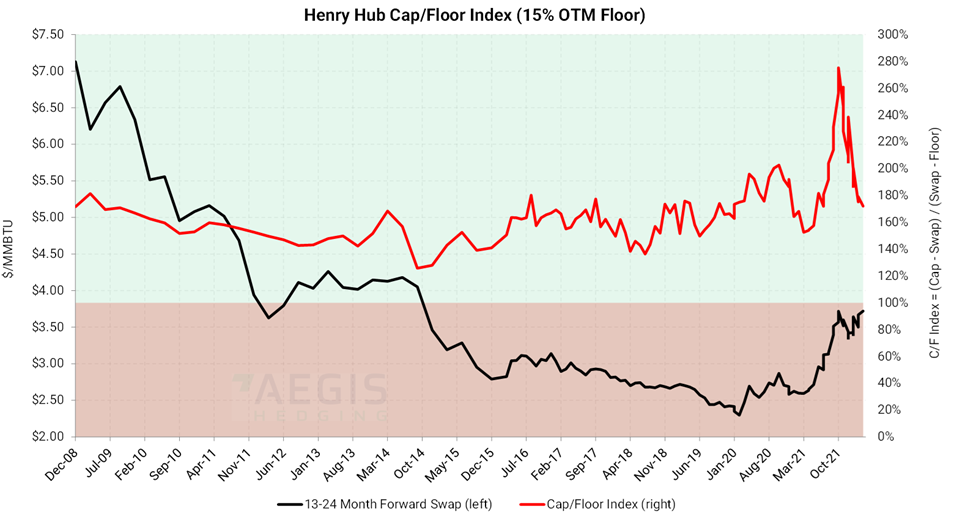
- Options markets are essentially probability markets and are not visible in the forward curve.
- The AEGIS cap-floor index represents how likely the prices will go up or down and by how much
- The chart shows the second-year strip, which spans months 13 to 24, and it demonstrates how expensive call options are compared to put options.
- Because a call option must be sold to purchase a put option, costless collars have advantages when call options are expensive
An example of real costless collars priced for our clients on March 10
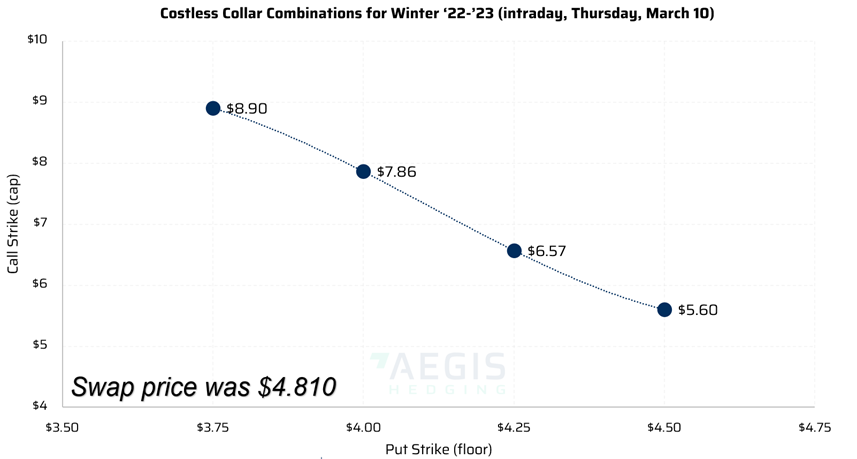
- The tenor for the trade is winter 2022-23 with a forward curve price of $4.81/MMBtu
- The chart shows the combination of costless collars at $4.50 and $4.25 put strikes that allowed for caps of $5.60 and $6.57, respectively
- Choosing a lower floor with more risk, such as $4.00 and $3.75 floor, allows for higher caps of $7.86 and $8.90
- The $4.50 floor allows you to be capped at $5.60 at a swap price of $4.81.
- You give up more upside when choosing more protection with a higher floor to keep the collar costless
- You start getting protected at 31c below, but you do not start getting capped until prices rise by 79c because the cap is $5.60
- Call skew is the cause of the mismatch. It is more common in gas markets than in oil markets, especially for winter tenors, and when prices have been rising.
U.S. Storage Injection
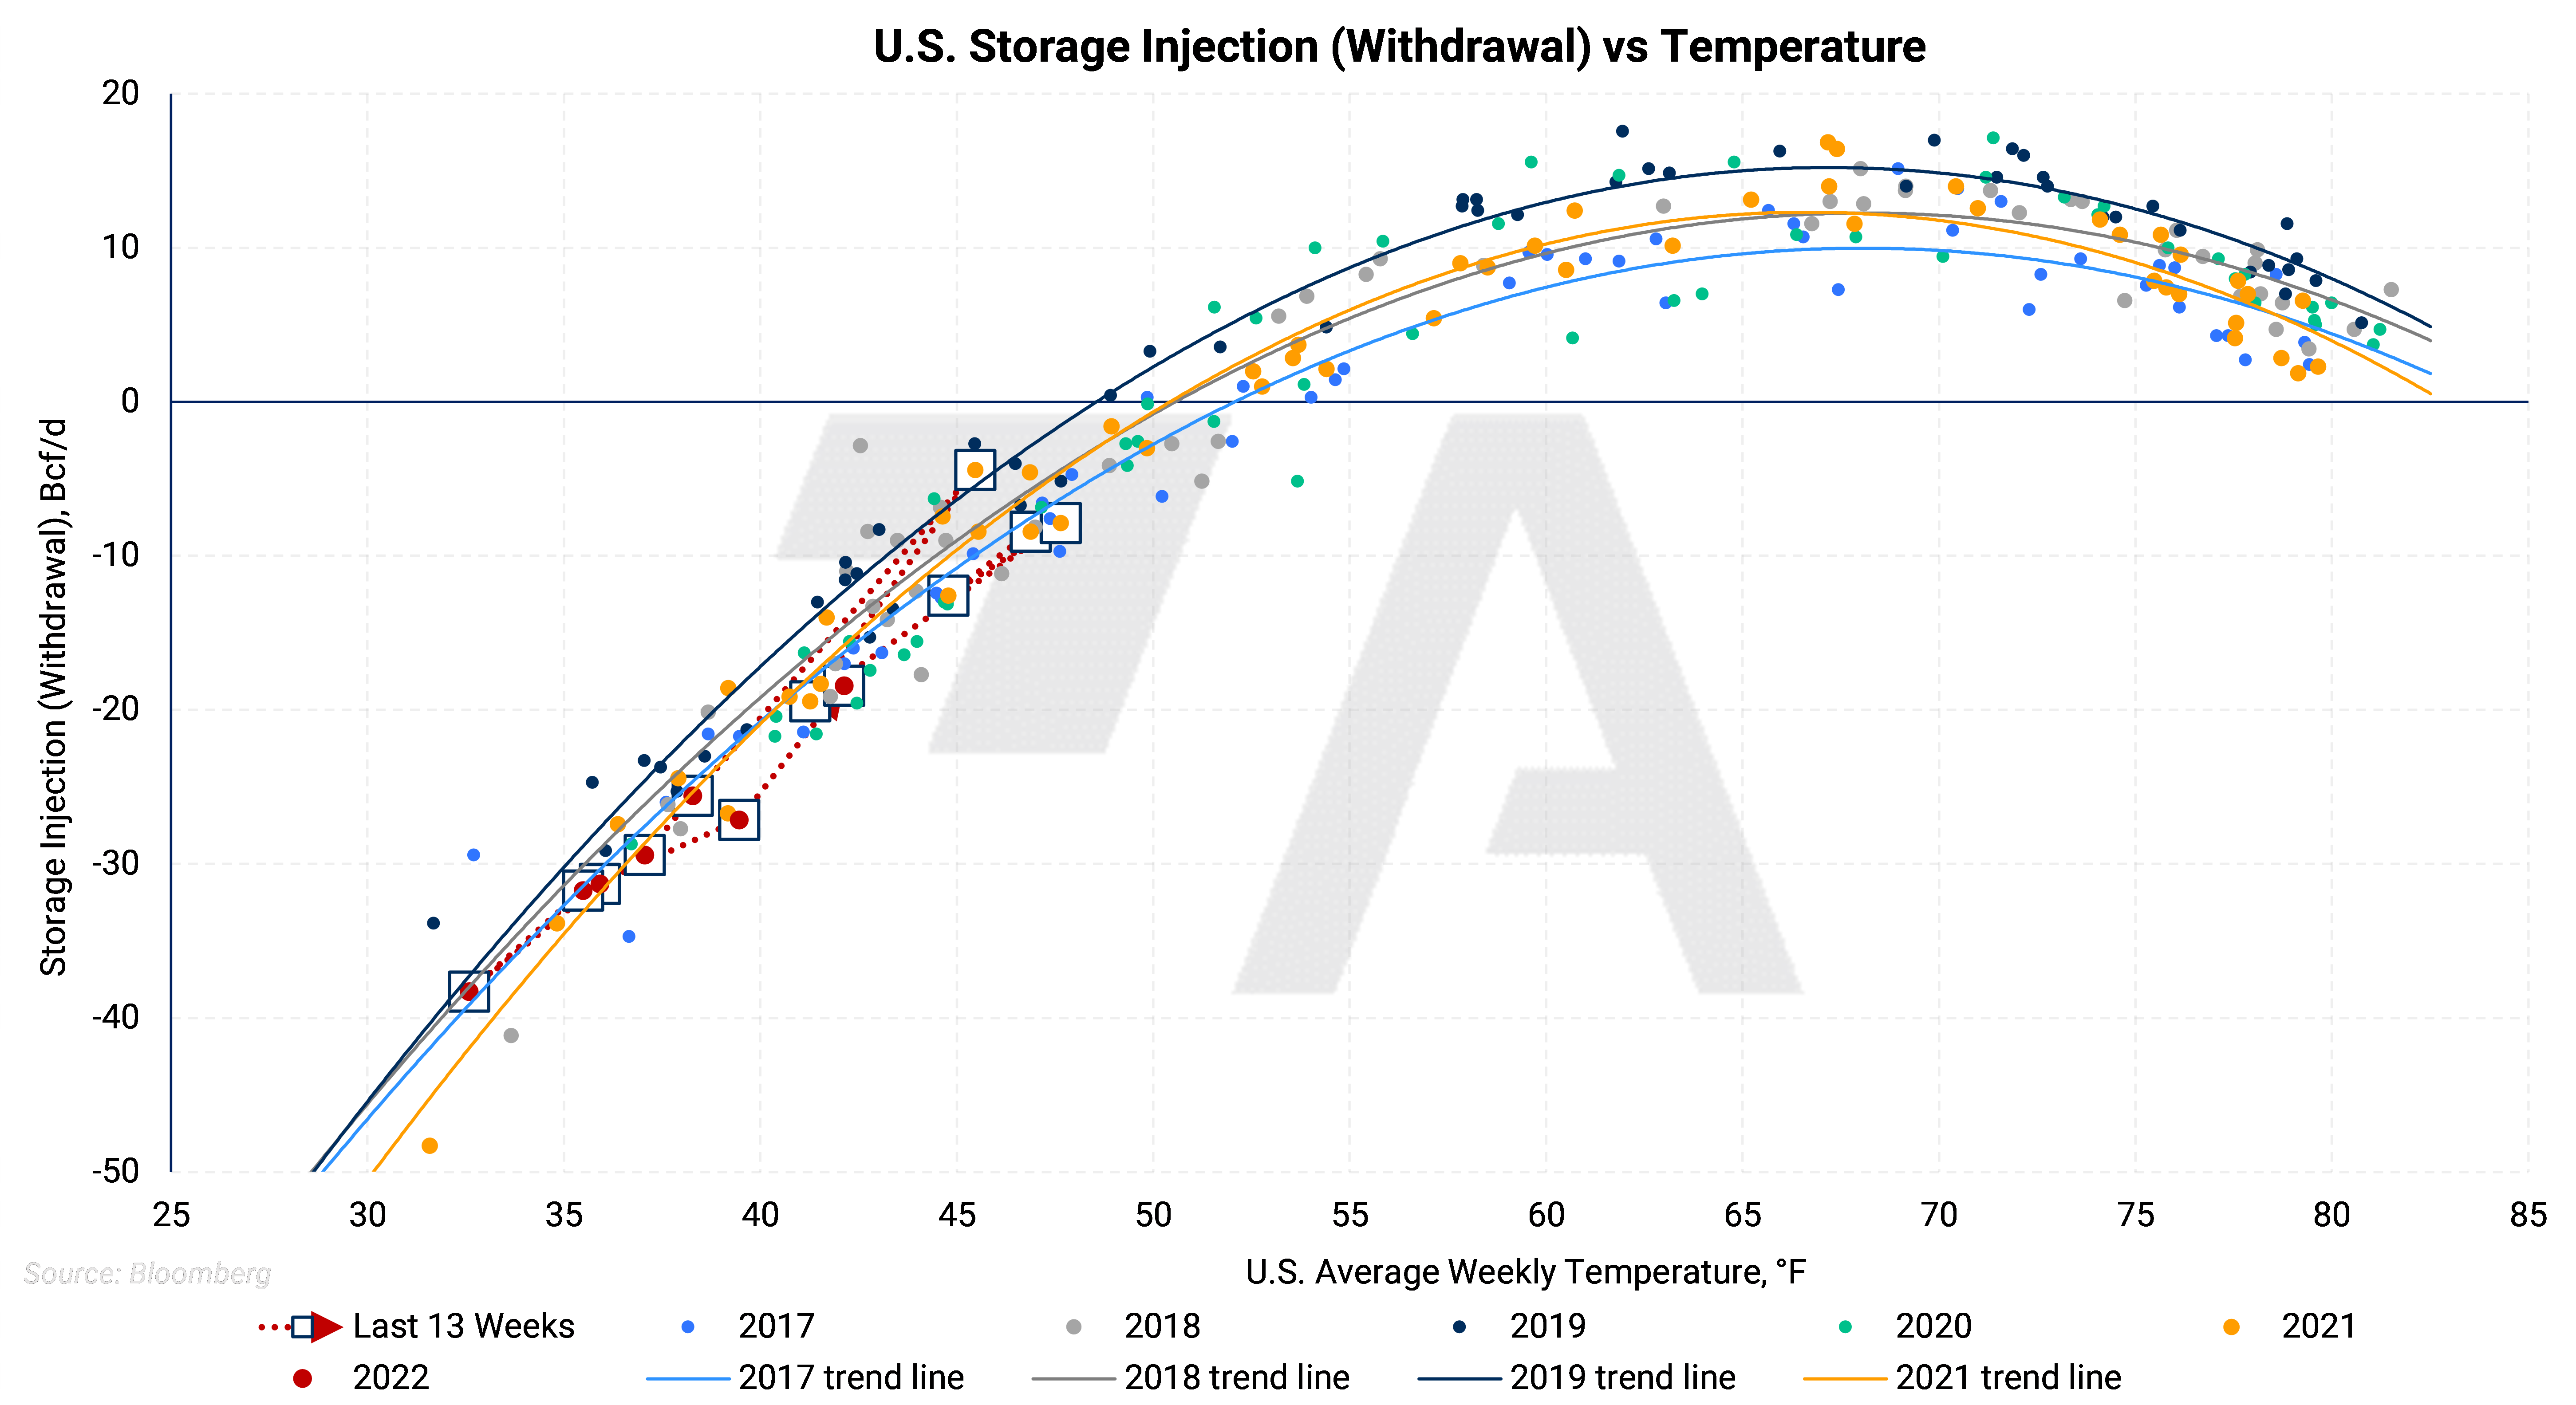
- The chart shows the difference in supply-demand for each week historically with respect to temperature
- The temperature effect needs to be removed to understand the true supply-demand balance
- Any dots below the trendlines are bullish (positive for prices) because there is greater net demand or less net supply at that temperature than the historical average
- The dots have recently been bullish, as they were last year, but we need to quantify how bullish they are and how long they will continue
Weather Adjusted Supply/Demand Balance vs. 3-Year, 5-Year Average
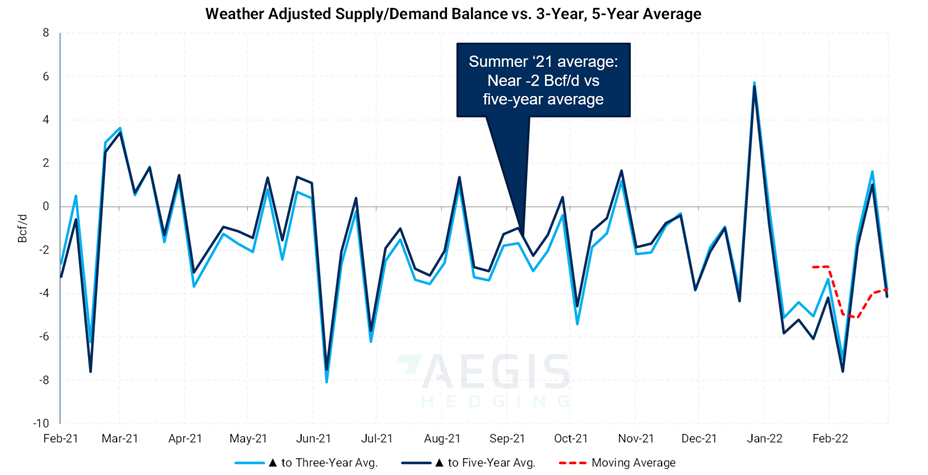
- This chart shows the reorganized scatter plot from the previous slide
- The distance between the dots and the trendlines determines the positives and negatives. In comparison to the five-year average, last summer's average temperature was roughly -2 Bcf/d. This is normally bullish, especially around the end of the summer
- This year has seen some pretty bullish prints. Recently, the figures have been modest, and we'll keep a close eye on it. There is reason to believe that the market will remain tight this year. Furthermore, we are starting the summer with fairly low inventories
Demand Components
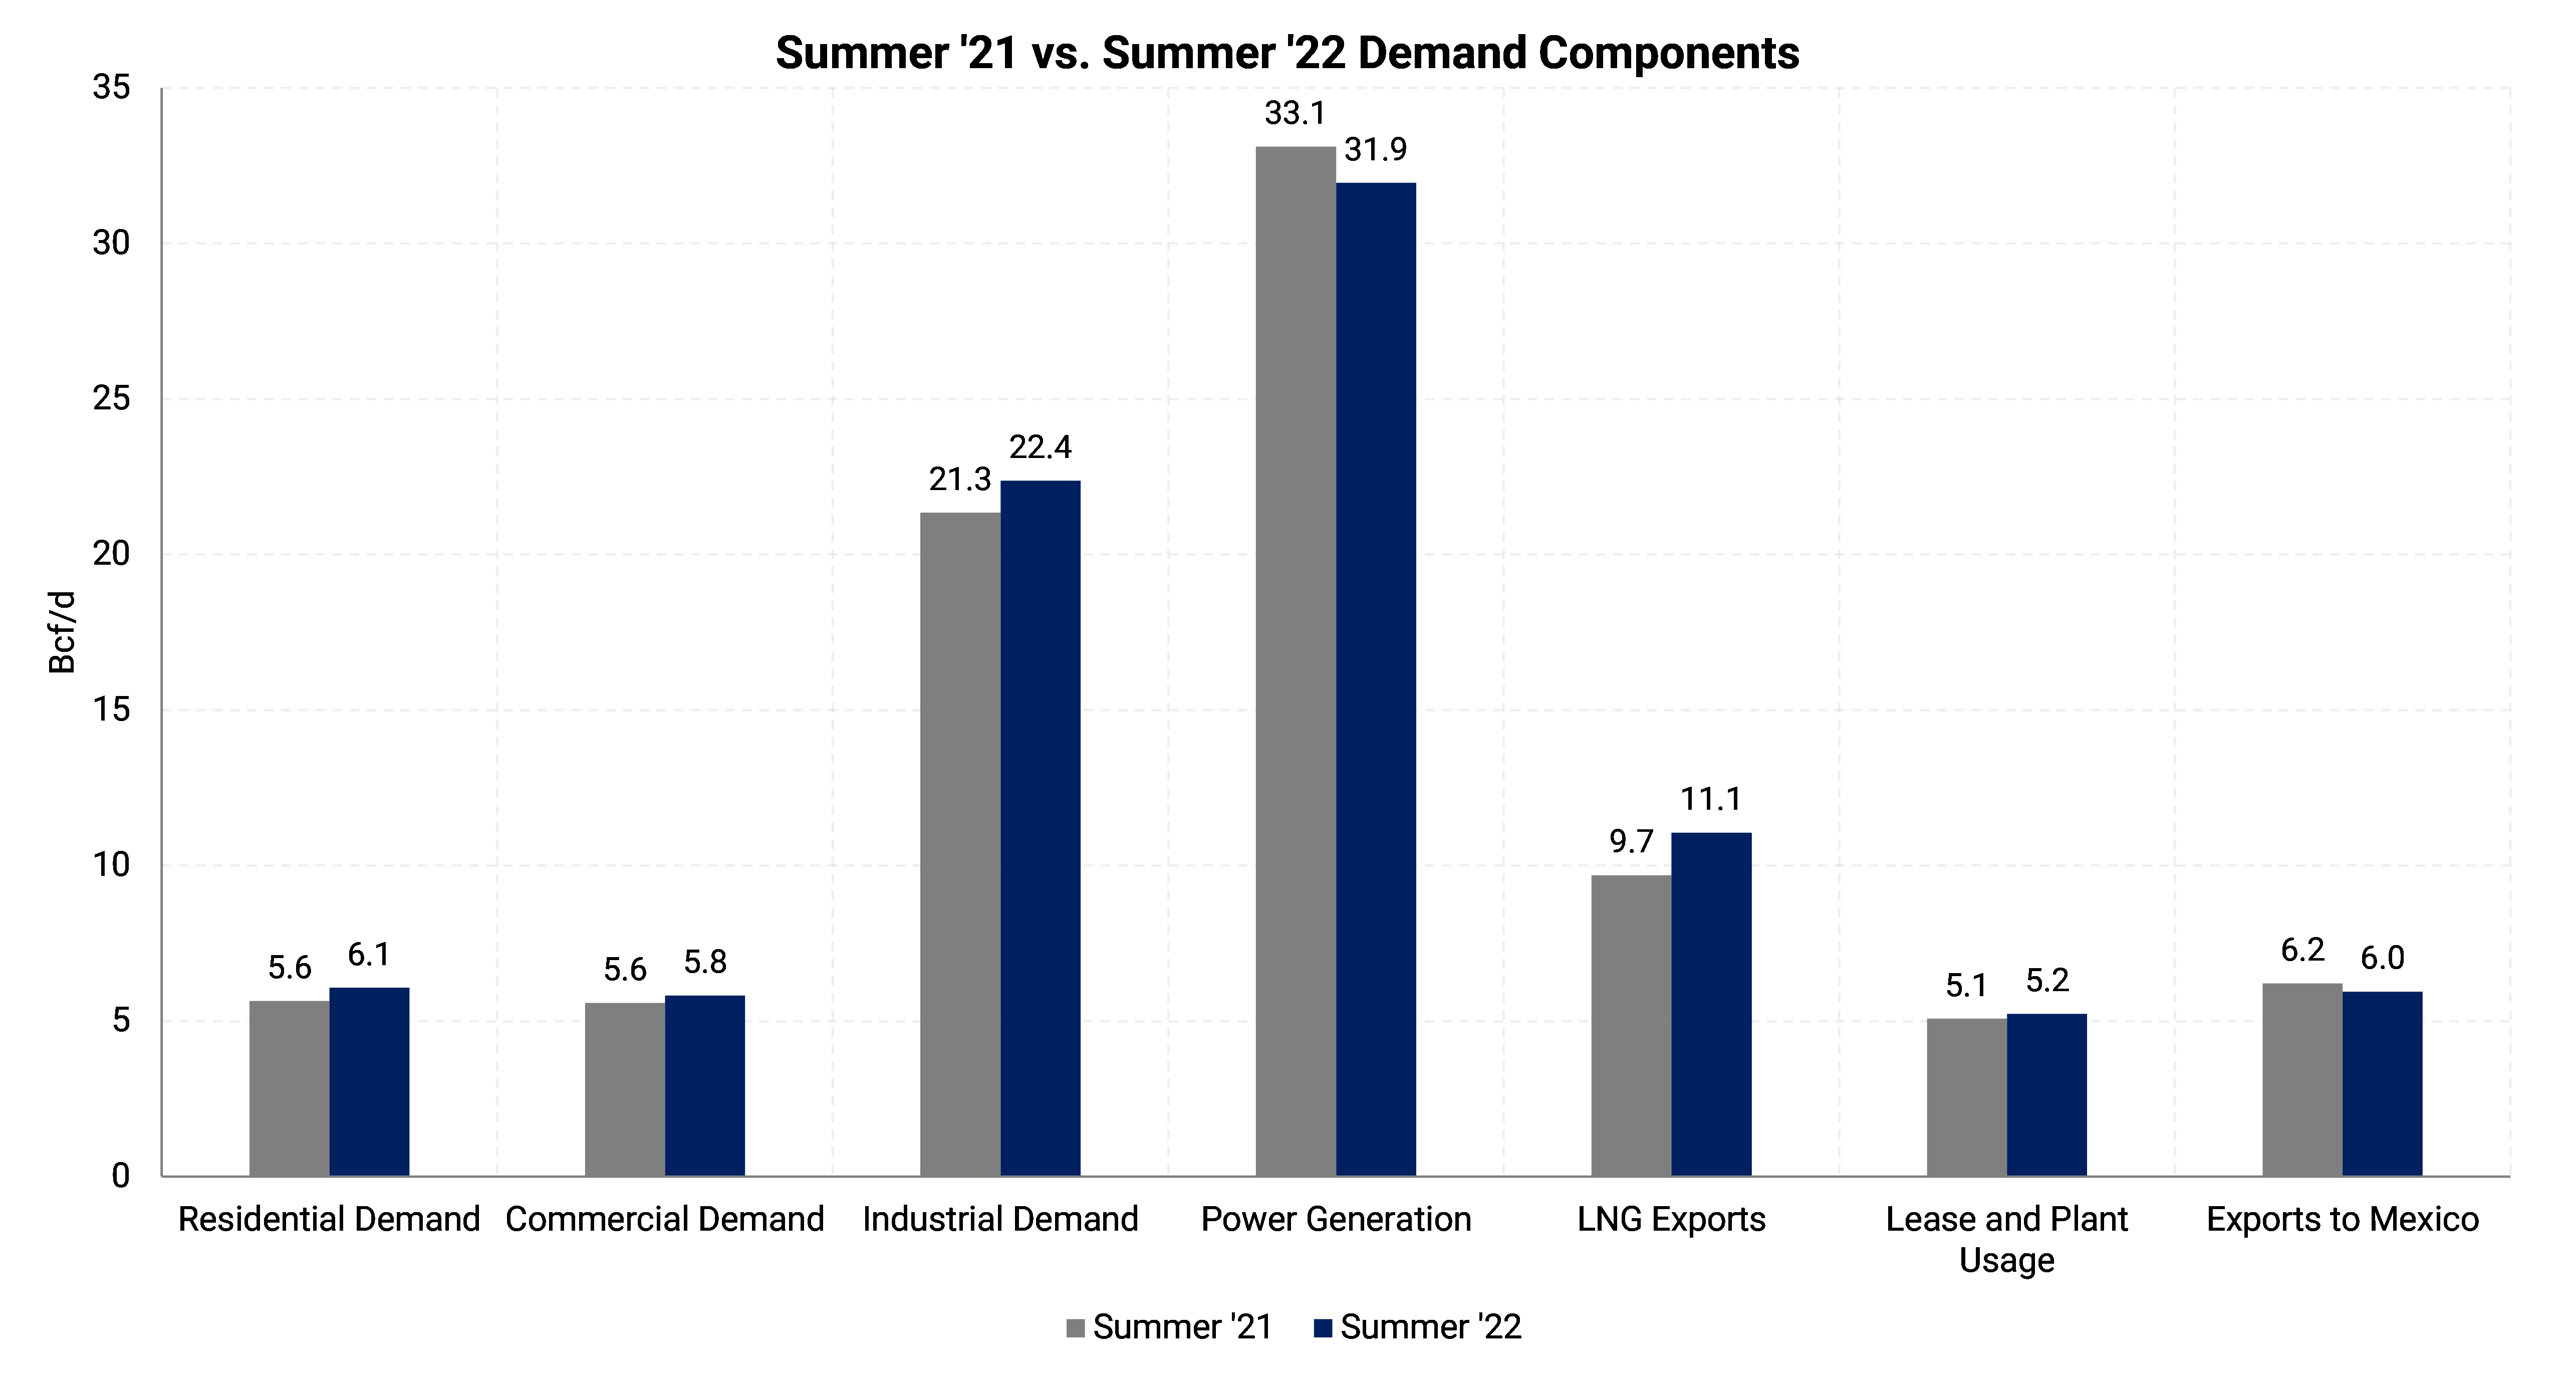
- These are the actual demand figures from last summer, along with EIA's demand forecast for this summer.
- There are gains in industrial, commercial, residential, and LNG exports. Higher utilization with the expansion of economy and manufacturing.
- Mexico's exports fell as they didn't expect as much heat or air conditioning demand in the south. There are power outages; not expecting a particularly hot summer, but rather a typical one.
Forecasted Supply-Demand Balance
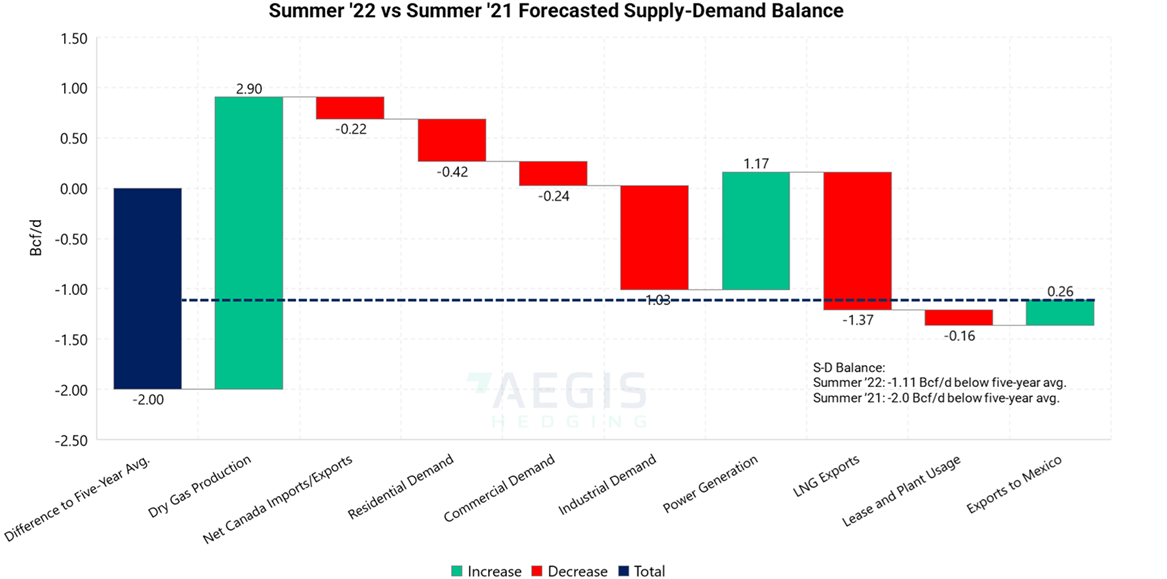
- This is a waterfall chart; it is a cumulative effect. Everything is arranged in terms of net supply. If you have an increase in demand, it's going to be a negative value on this chart.
- Beginning with an S&D deficit of -2.0 bcf/d from 2021 and increasing that by 2.9 bcf/d of expected production forecast from EIA. Now there is a healthy increase in gas production
- The EIA expects fewer Canadian imports, increased industrial utilization, and increased LNG exports; however, there would be less power generation due to the relatively lower summer temperatures and renewables displacing gas
- All together, the market would still be 1.1 Bcf/d undersupplied, compared to the five-year average supply-demand balance. This is 0.9 Bcf/d better supplied than last summer but implies the market will face difficulty in building inventories this summer.
- In the past, whenever inventories did not keep pace with the five-year average, it acted as a bullish factor. It still leaves us with a -1.1 bcf/d from the five-year average. That means inventories will have a hard time keeping pace through summer going into next year's inventories. It would be more pronounced if temperatures are hot or if coal and renewables underperform.
Global LNG Prices
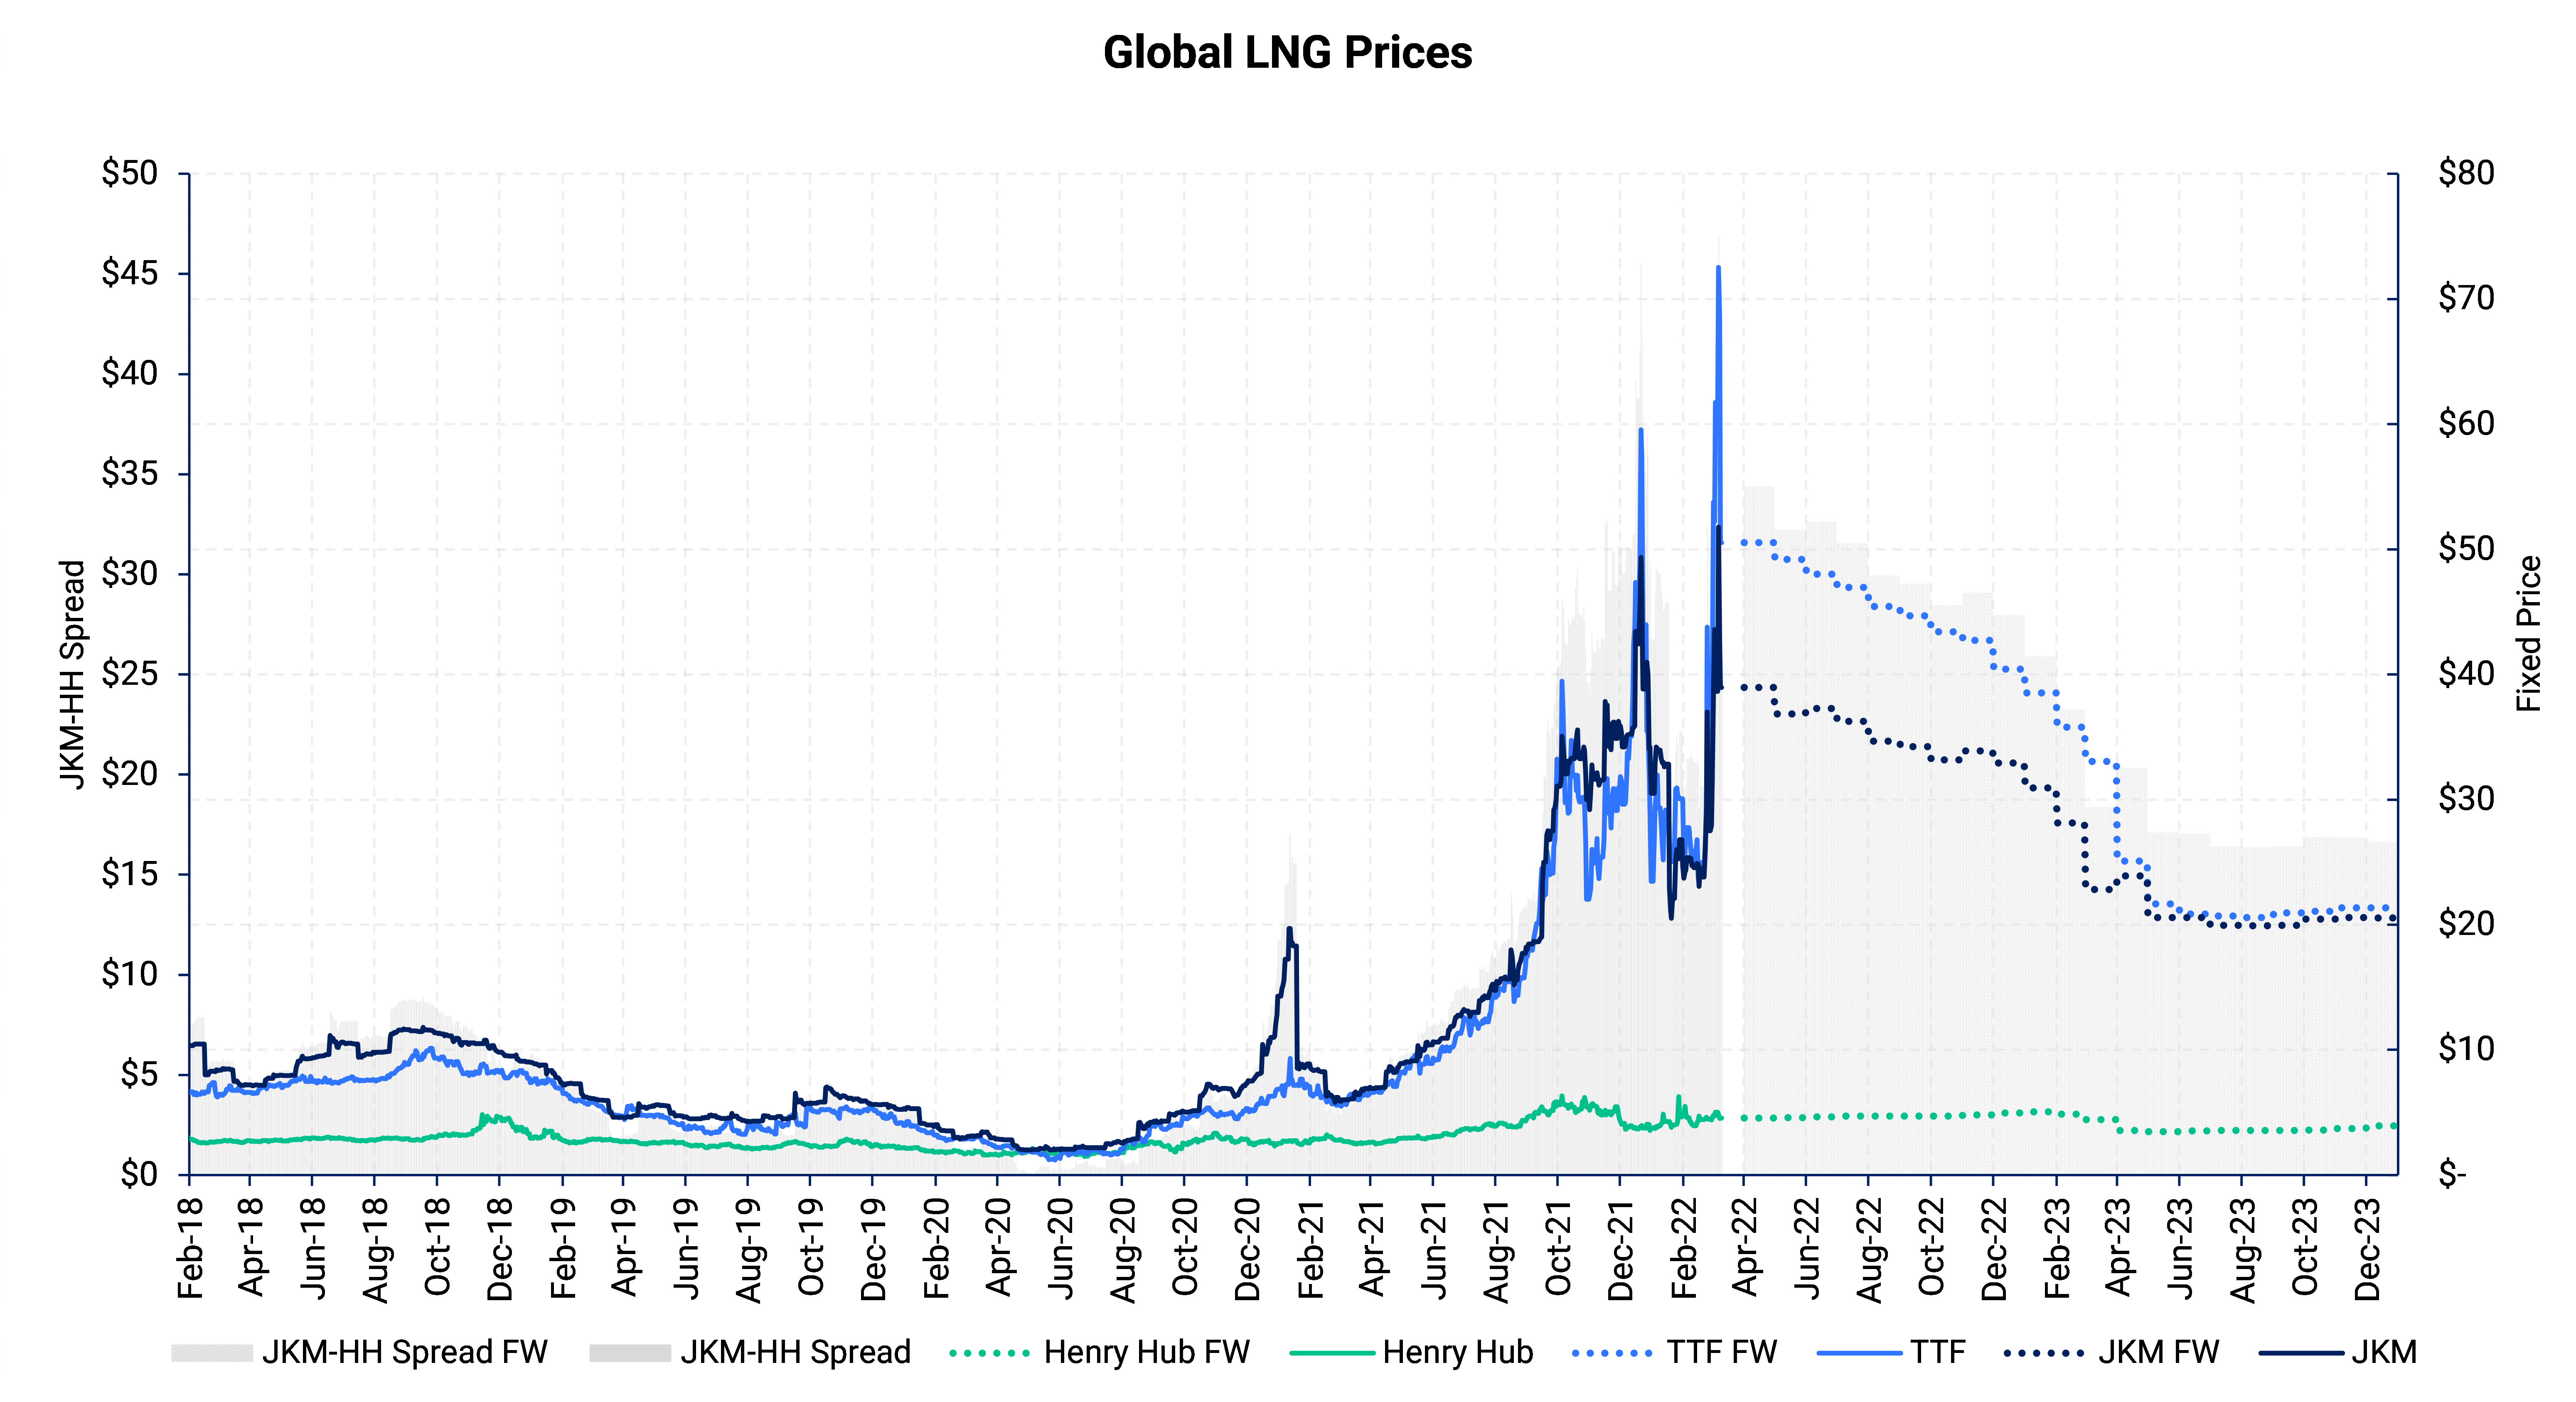
- European gas prices skyrocketed in the last couple of weeks as around 35% of European gas is supplied by Russia depending on the season
- The canceled Nord Stream II pipeline would act as a bullish factor for the back of the TTF curve
- A lot of the gas flows through Ukraine and it is still at risk due to the conflict
- Volatility in the European gas markets has little impact on Henry Hub
Waha Seasonal Strips
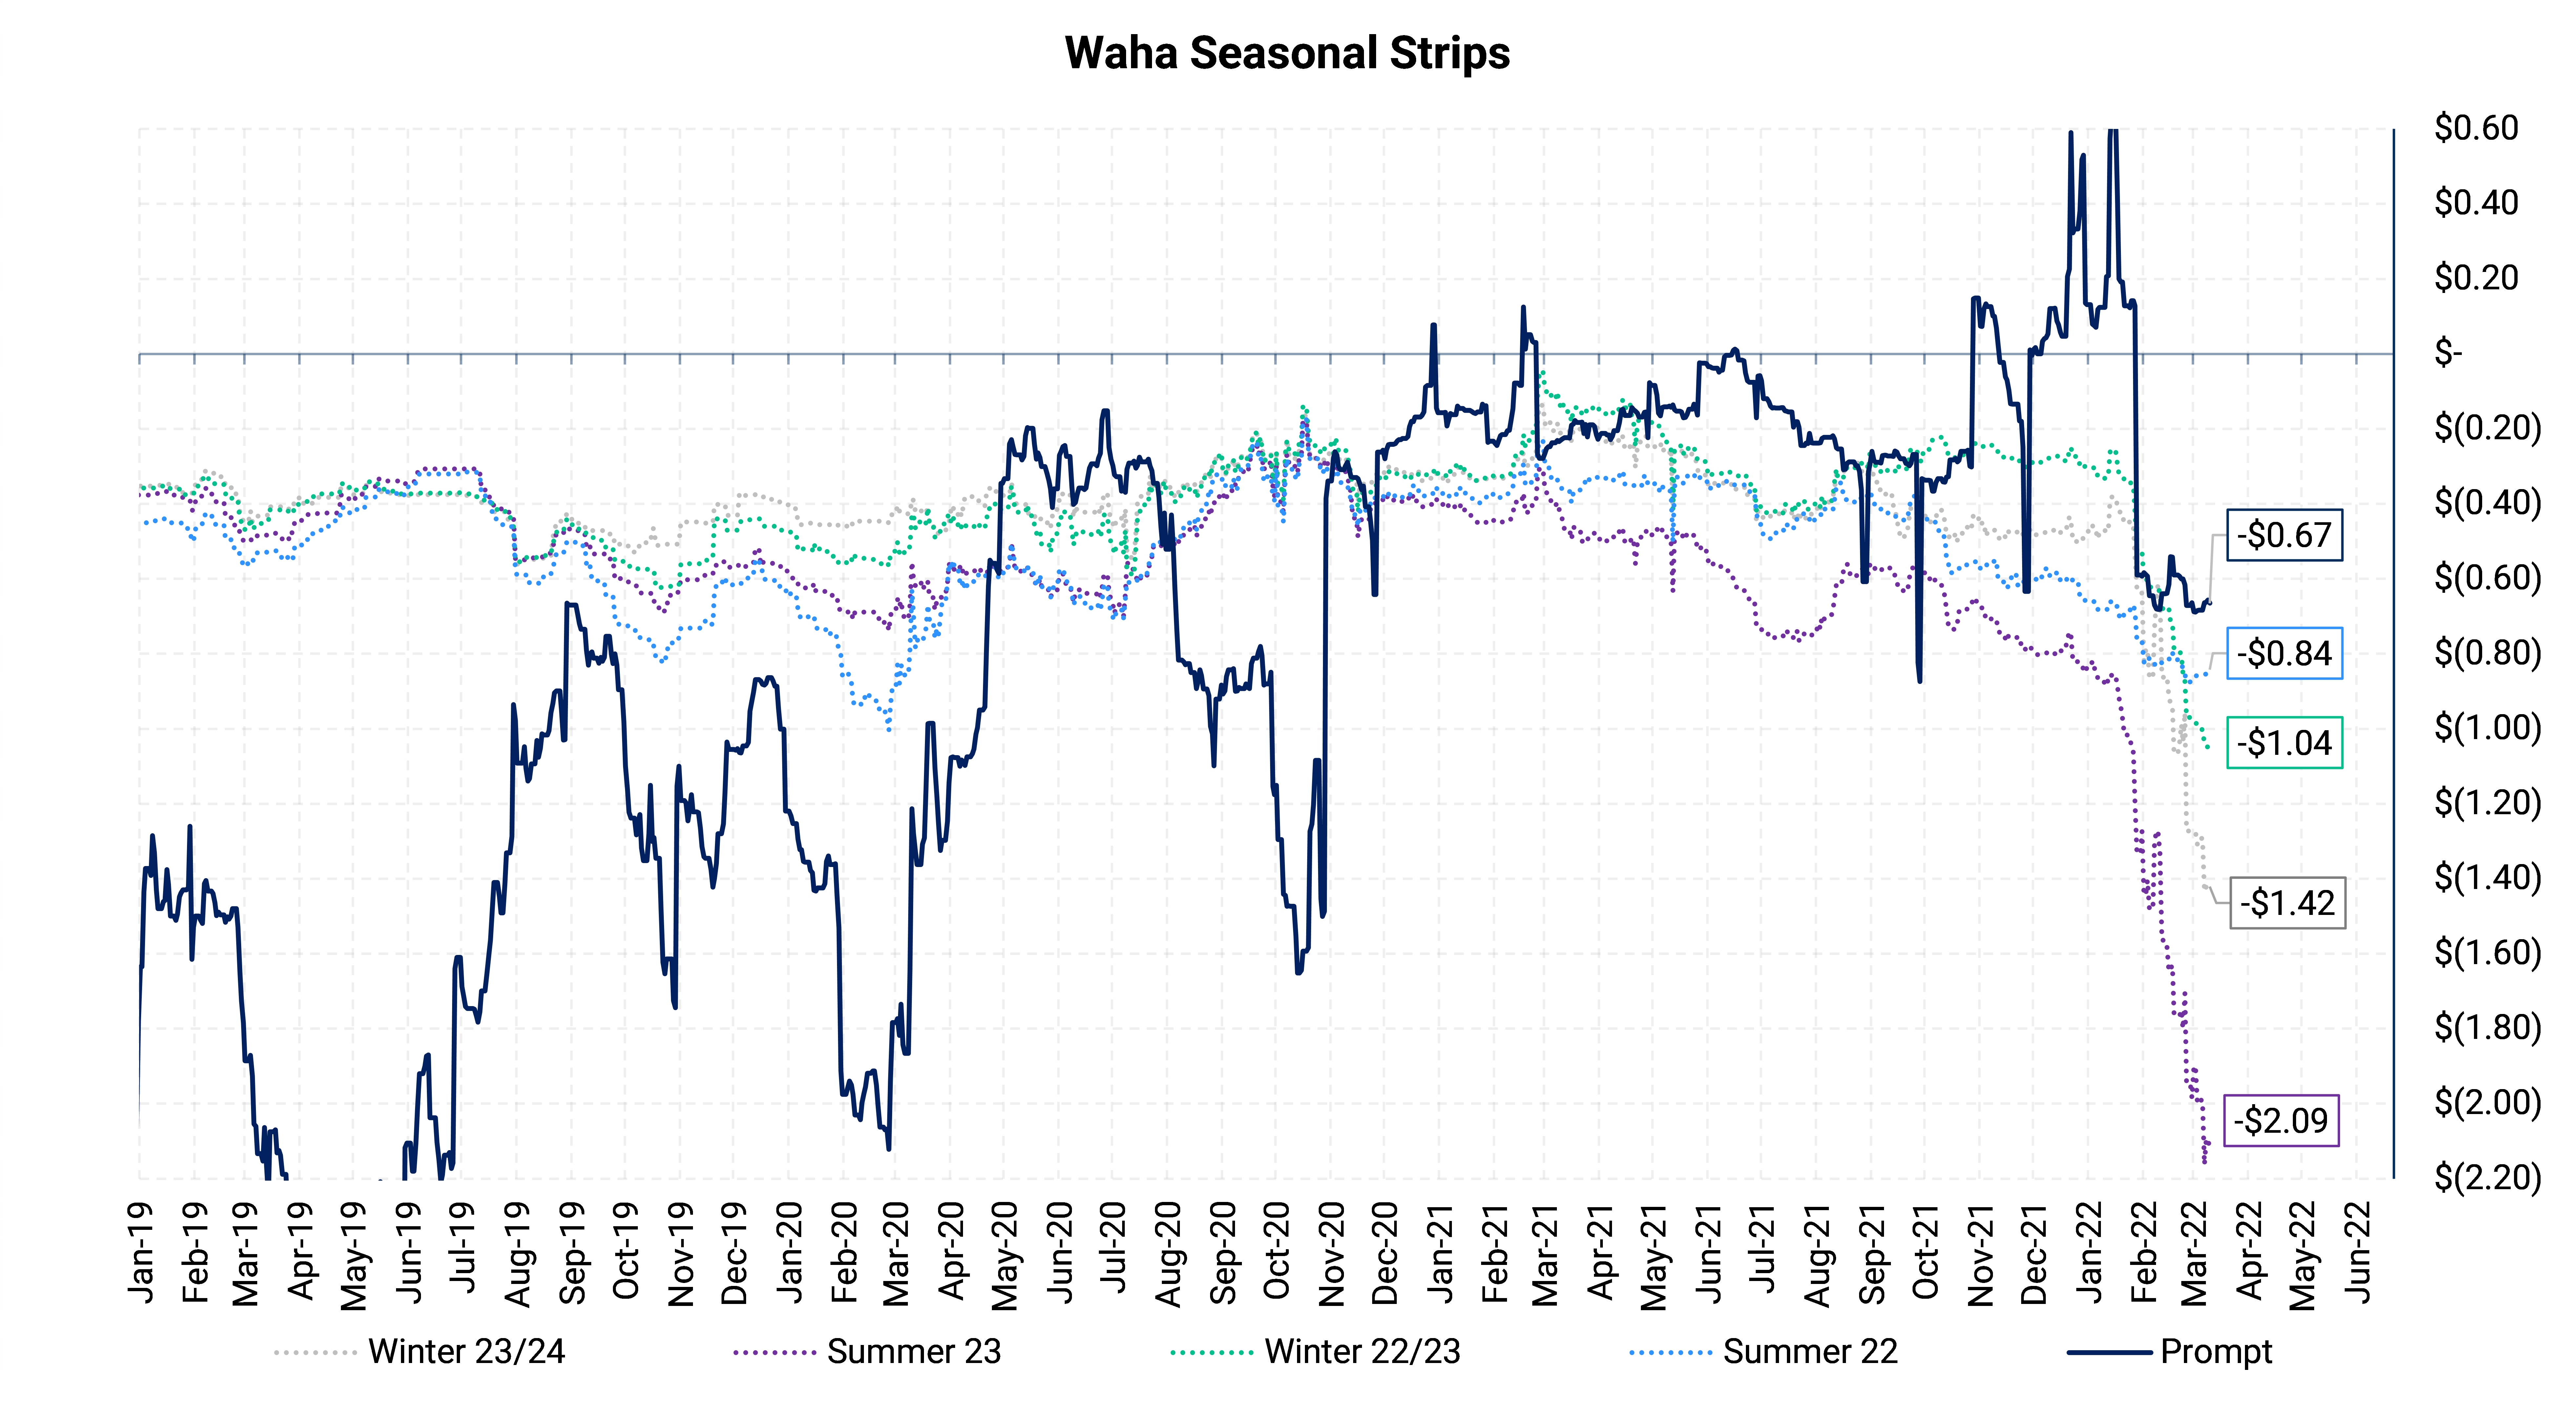
- The summer ‘23 and winter ‘23/’24 strips have moved the most. Producers are likely forward selling them as hedges. This is pushing down the hedgeable price for others.
- Please contact us if you are in a situation to look at these hedges. We can walk you through with what your choices are
Factor Matrix – Natural Gas
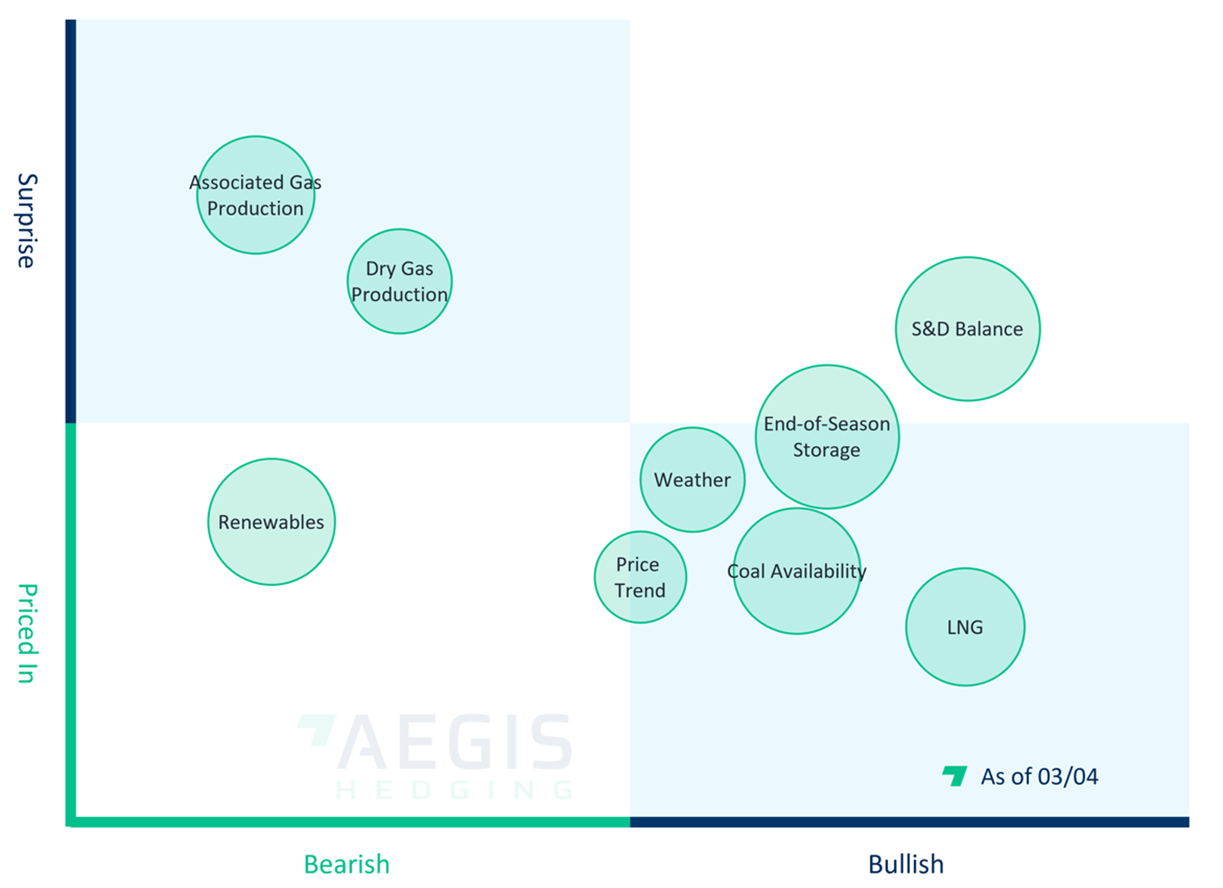
- Although the S&D balance is priced in, it is underappreciated. Keep an eye out for late spring and early summer
- EOS Storage is fairly low, it has the potential to add pressure to move prices up
- There is not enough coal to compete with natural gas effectively. It lifts the floor price and the ceiling price for gas, so gas just does not have any competition when the prices rise
- We are watching production as it affects the domestic balances
Trying to make your cash flows certain in 2022-23? Not only can oil and gas prices be hedged, but also consider diesel, interest rates, steel, carbon, and power! Talk to a strategist at AEGIS at info@aegis-hedging.com.