Option structures are useful tools to deploy in risk management. They provide more latitude for hedging than the more straightforward swap. Hedging with swaps still commands the most trade volume that we see, but today’s focus will be on the current state of options in the oil market.
The most typical option structure oil and gas producers use is the costless collar. This entails buying a put and selling an equal value call option for the same tenor, effectively making the structure “costless” as the counterparty credit charge or service fee are built in.
To add further complexity, a put and call, equal distance from the underlying swap, rarely has equal value in the oil market. The imbalance in premia has to do with implied volatility. Put options usually carry more implied volatility than the corresponding call.
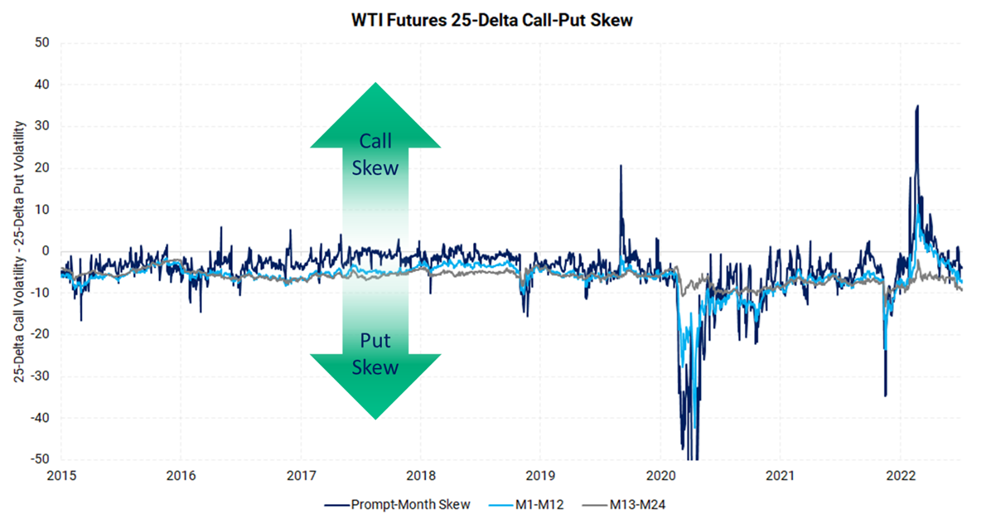
The chart below shows a comparison between the measurement of volatility for a 25-delta call and a 25-delta put. We can ignore a discussion about option deltas and focus on where the lines are with respect to the zero line. If the series is positive (above the zero line) there is call-skew; if it is below the zero line then the market is in put-skew. Notice how the lines are usually below the zero line, which indicates that the WTI market is typically in put-skew.
We have three different series in this chart. They correspond to the rolling prompt-month contract, WTI months one to 13, and months 13 to 24. This helps us measure put-skew in different parts of the forward curve. While the M13-M24 part of the curve has had put-skew almost perpetually, there have been times when the front of the curve (Prompt-Month and M1-M12 in our chart) have gone positive, to call-skew.

Producers will like the market in call-skew or as close as they can get to call-skew when placing costless collar structures. A producer is selling a call when executing on a costless collar, therefore, it is better if the call has a relatively higher price. A great example of when the oil market was presenting call-skew (at least in the first 12 months) was when Russia invaded Ukraine. The chart above shows the spike into call-skew in early 2022. Again, this is uncommon for the WTI options market.
Put-Skew Example
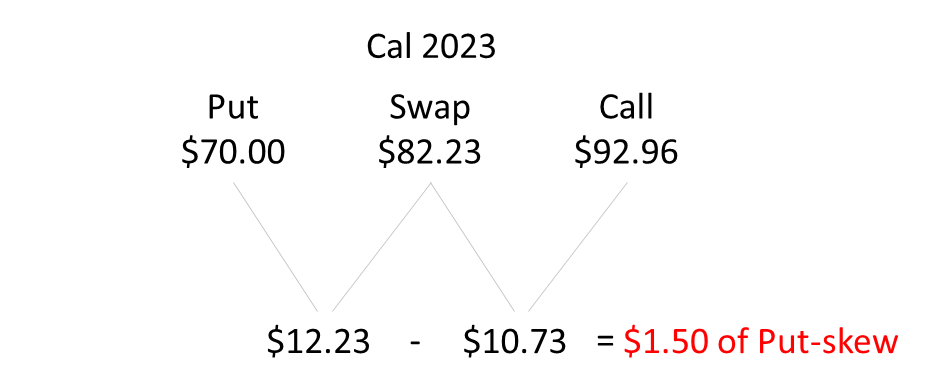
Below is a real-world example of what is typically found in the WTI options market. This “costless” collar was priced as of July 21, 2022 and shows $1.50/Bbl of put-skew. In this hedge, the producer set the purchased Put at $70.00/Bbl, or $12.23/Bbl below the market; however, they only receive $10.73 of upside due to the lower relative value of the sold call.

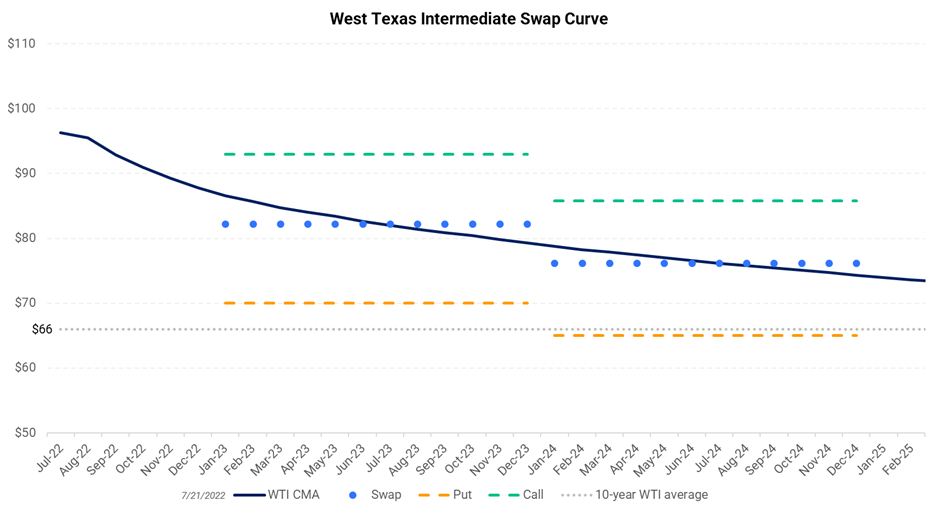
To visualize further we can look at the graphic below. Using the same structure values as the table above we can better see where our example sits relative to the market. For Cal 2023, the first set of blue dots show the swap value at $82.23, staged between the $92.96 call (green dash) and the $70 put (orange dash).

It’s important to keep in mind that option skew is only one metric to consider when determining whether to hedge with a swap or collar. AEGIS often recommends collar structures for fundamental reasons despite the put-skew in the oil market. If you closely watch the relative value between puts and calls, occasionally you can find call-skew opportunities. Options are simple to understand but difficult to value. Sometimes there are different amounts of skew depending on how wide or narrow you set your strikes versus the swap, but our trading team can provide details on that topic.
For those clients looking to add hedges soon, a costless collar is still possible (late July, 2022) where the floor, or put, is above the 10-year average WTI price.