Today’s EIA gas report survey was completely off the mark with a draw of 31 Bcf. To put that in perspective, most analyst’s estimates were in the mid 50’s. The surprise is mostly in the South-Central region with a total injection of 27 Bcf, 21 Bcf from salt caverns specifically.
Fundamentally, last week was a warm holiday week with production reaching 97 Bcf/d (according to IHS/PointLogic). Holiday weeks are notoriously hard to predict – throw in COVID and that complicates it even further.
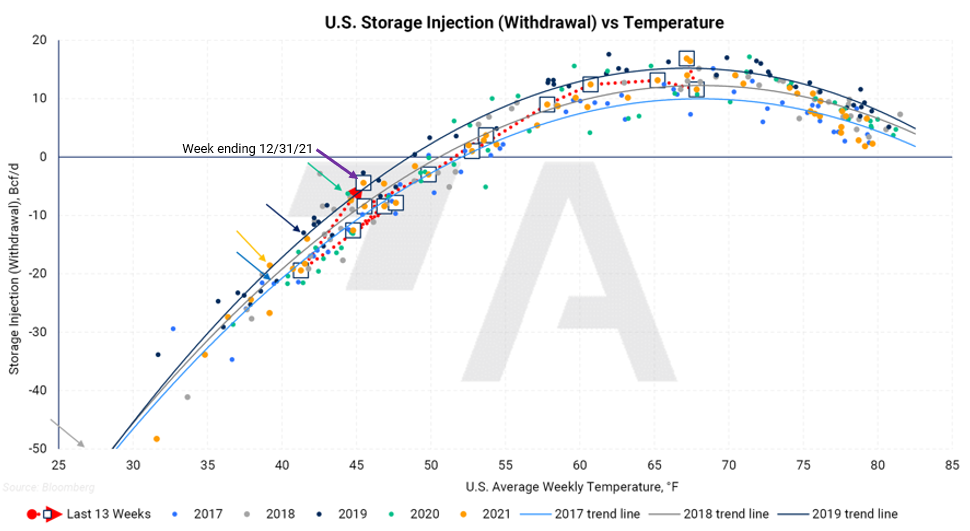
Using just a simple comparison of injection/withdrawal vs average US temperature over time, outcomes generally fall within a range. When we look specifically at data points that represent the end-of-year holiday week (see the color-coded arrows in the chart below), we often see a high incidence of outliers - generally showing loose markets. This week's data point shown below is no exception.

AEGIS Research thinks there may also be something else going on here - the fact that the number is as of December 31. Storage operators pay particular attention to their end-of-year gas balance number that ultimately gets reported on the balance sheet. Any corrections to actual gas balances show up in this number which may account for the large difference in expectations vs the EIA reported storage balance.
The price action pre and post number indicates that the market has discounted this week’s bearish storage report. Gas initially dropped a little more than a nickel before quickly recovering. Price action today has been choppy but likely based more on weather runs than on EIA stats.
This week’s puny draw is likely the low point for at least the next several weeks. Freeze-offs and cooler weather suggest draws in the 150-210 Bcf range for each of the next three weeks. The end-of-season storage swap on ICE remains at 1,600 Tcf which seems to be the focus as we move into the heart of winter.