Utilities, gas producers, and midstream companies have recently been calling attention to projections of massive electricity demand growth driven by data centers, but the reality may be underwhelming. Claims by natural gas producers and midstream companies, such as EQT and TC Energy, for 10-18 Bcf/d of power sector gas demand growth by 2030 appear to be overstated, especially when accounting for the growth of renewables. Our estimates for renewables growth have been adjusted for capacity factor and converted to Bcf/d by assuming a 7k btu heat-rate. Our calculations actually show a sizeable decline in natural gas power generation by 2030.
The incoming demand from planned data centers does appear sizeable, with McKinsey forecasting 35 GW of additional electricity demand from data centers by 2030. If 100% of this demand was served by low heat rate natural gas power plants, that would equal about 7 Bcf/d of gas demand. This, combined with 6.21 Bcf/d of coal retirements and 2.45 Bcf/d of new gas plants, according to the EIA’s latest generator inventory, may lead to the conclusion that a significant amount of gas demand is coming. However, by 2030, 21.8 Bcf/d of renewables may have entered service, and 0.69 Bcf/d of older gas-fired power plants will have been retired. It is also important to note that there could be a large error term in what the EIA is currently projecting regarding coal retirements and renewable additions, as these schedules can often be disrupted by changes in market conditions or the regulatory environment.
ISO load forecasts have often been overstated.
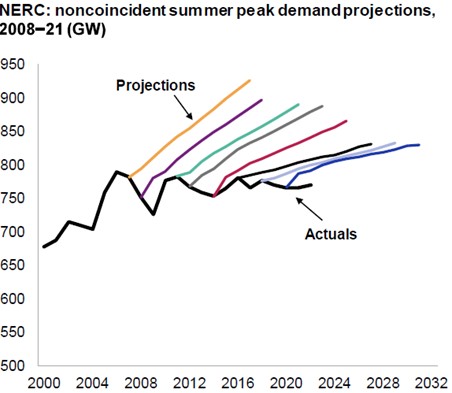
Starting with the load growth forecasts themselves, utilities and grid operators have rarely been correct about their expectations of electricity demand, often severely overstating the amount of actual growth.

The chart above, from S&P Global and NERC, shows how peak load forecasts have panned out over the past 20 years. Long-term forecasting is a difficult endeavor, and in addition to that, ISOs are responsible for maintaining reliability on their respective grids, so they can be incentivized to overstate the amount of demand coming to support the continued buildout of generation assets. There could also be an element of double counting. Data center developers may submit requests to multiple ISOs before settling on a final decision of where it will be constructed.
Renewables may offset incoming gas demand.

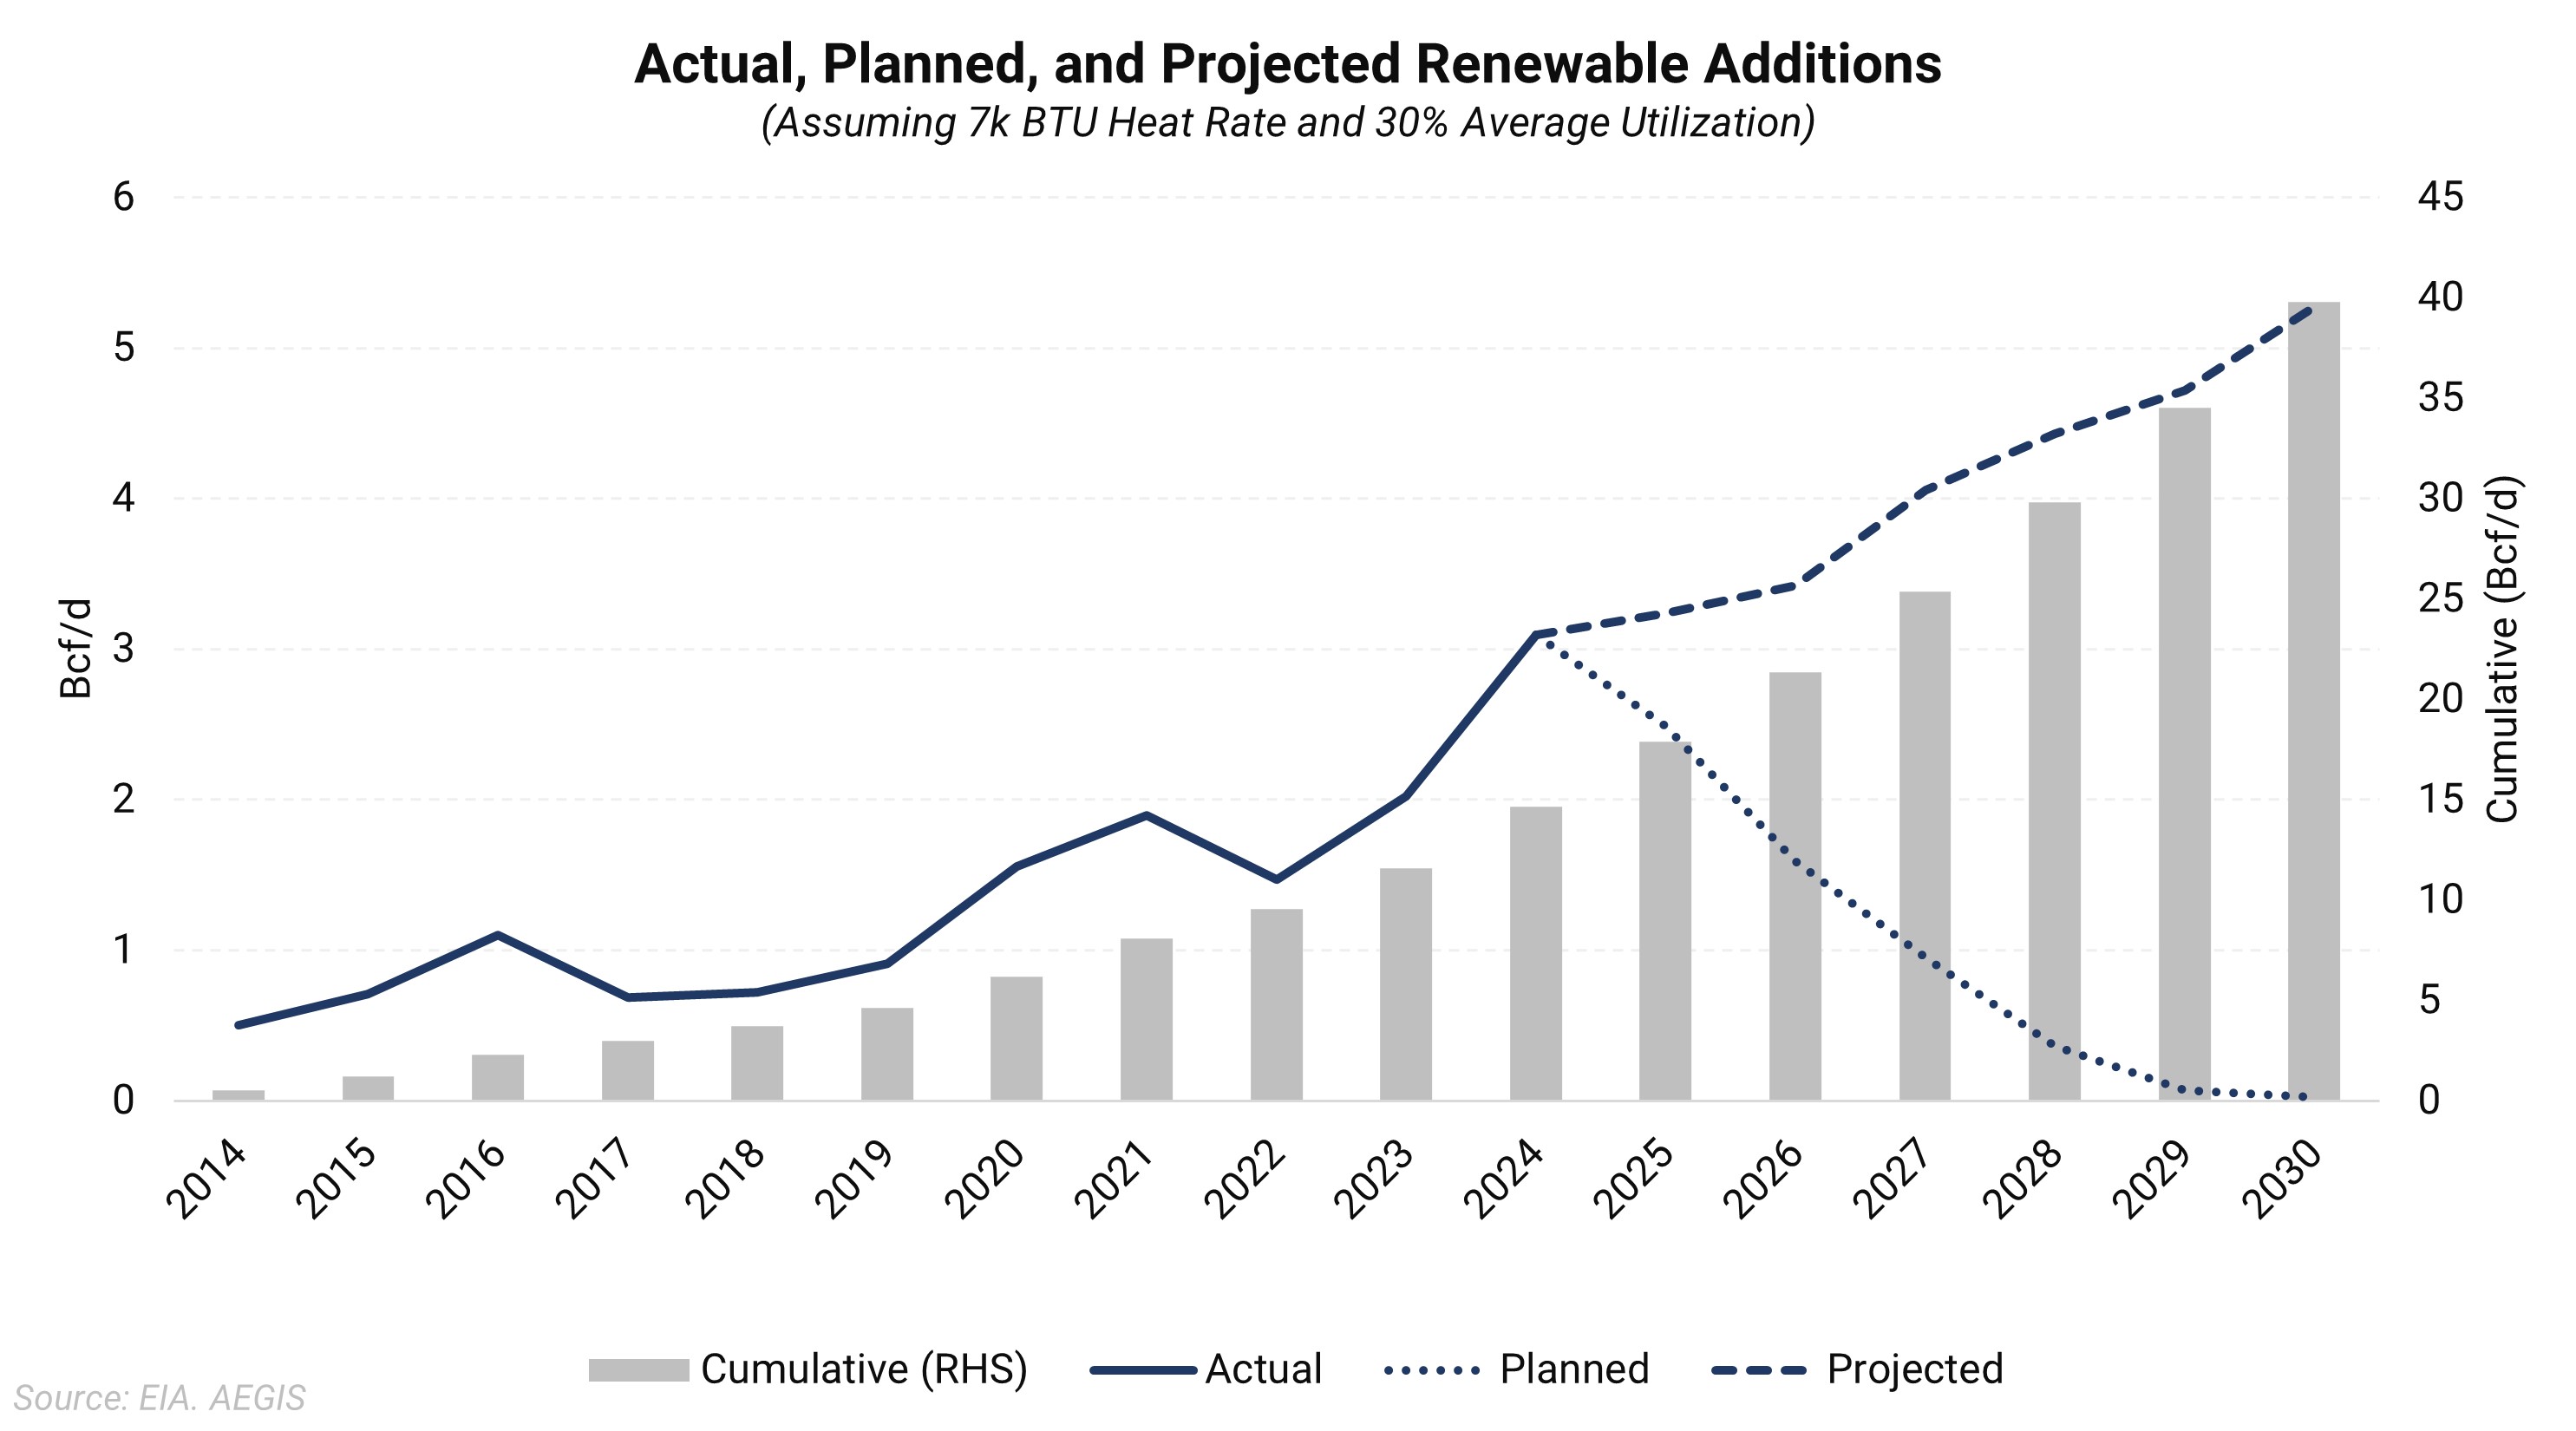
If power demand growth forecasts do pan out, the growth in renewable generation may offset all of the additional load. By 2030, a significant amount of renewables is expected to have been added, which is about 109 GW after applying a capacity factor. When converting to gas demand, it is roughly equivalent to 21.8 Bcf/d, assuming all of it is displacing low heat-rate efficient gas plants. The chart above shows the amount of renewables currently planned or under construction (downward sloping dotted line) and the cumulative amount of gas demand displaced (grey bars) over the past ten years. It may appear that there is a downward trend, but that is due to planning, as it is likely that more renewable projects will be added in time. We have used the historical growth rate to forecast future renewable buildout, as represented by the dashed line. Our projection is that this will lead to about 109 GW of growth between 2024 and 2030. While there are times when wind and solar assets do not perform, and gas generation must be ramped up, on average, this growth in renewables should steal a significant amount of demand away from natural gas. Changes to the regulatory environment, such as the Inflation Reduction Act, can also impact the growth of renewables by speeding up or delaying the permitting and planning process.
Considering these factors, we calculate that gas demand for power generation may actually decline by a sizeable amount of 6.83 Bcf/d.
To summarize the calculation:
|
Expected Power Sector Changes and Gas Demand Impact 2024-2030 |
||
|
|
GW |
Bcf/d |
|
Coal Retirements |
31.07 |
6.21 |
|
Renewables |
109.00 |
21.80 |
|
Gas Additions |
12.24 |
2.45 |
|
Gas Retirements |
3.44 |
0.69 |
|
Load Growth |
35.00 |
7.00 |
|
Gas-Fired Power Demand Change |
-34.13 |
-6.83 |
The table above shows the expected changes in various components impacting natural gas fired power demand growth. While factors like coal retirements and load growth should lead to an increase in demand, factors such as renewables lead to a decline in demand. The sum shows the net change to demand growth and, with the number being negative, indicates a decline in demand.
In conclusion, after adjusting for renewables, power sector gas demand growth may not be as robust as some forecasts show. However, there may be more pronounced regional effects. With a significant percentage of data center demand in Northern Virginia and the PJM region, the effect on regional gas basis pricing may be larger than that on Henry Hub. The main takeaway is that several aspects of these forecasts have a very large error term. While it may be easy to say that the load growth estimates will equal strong gas demand growth, we are attempting to take a more realistic approach, given the information available.