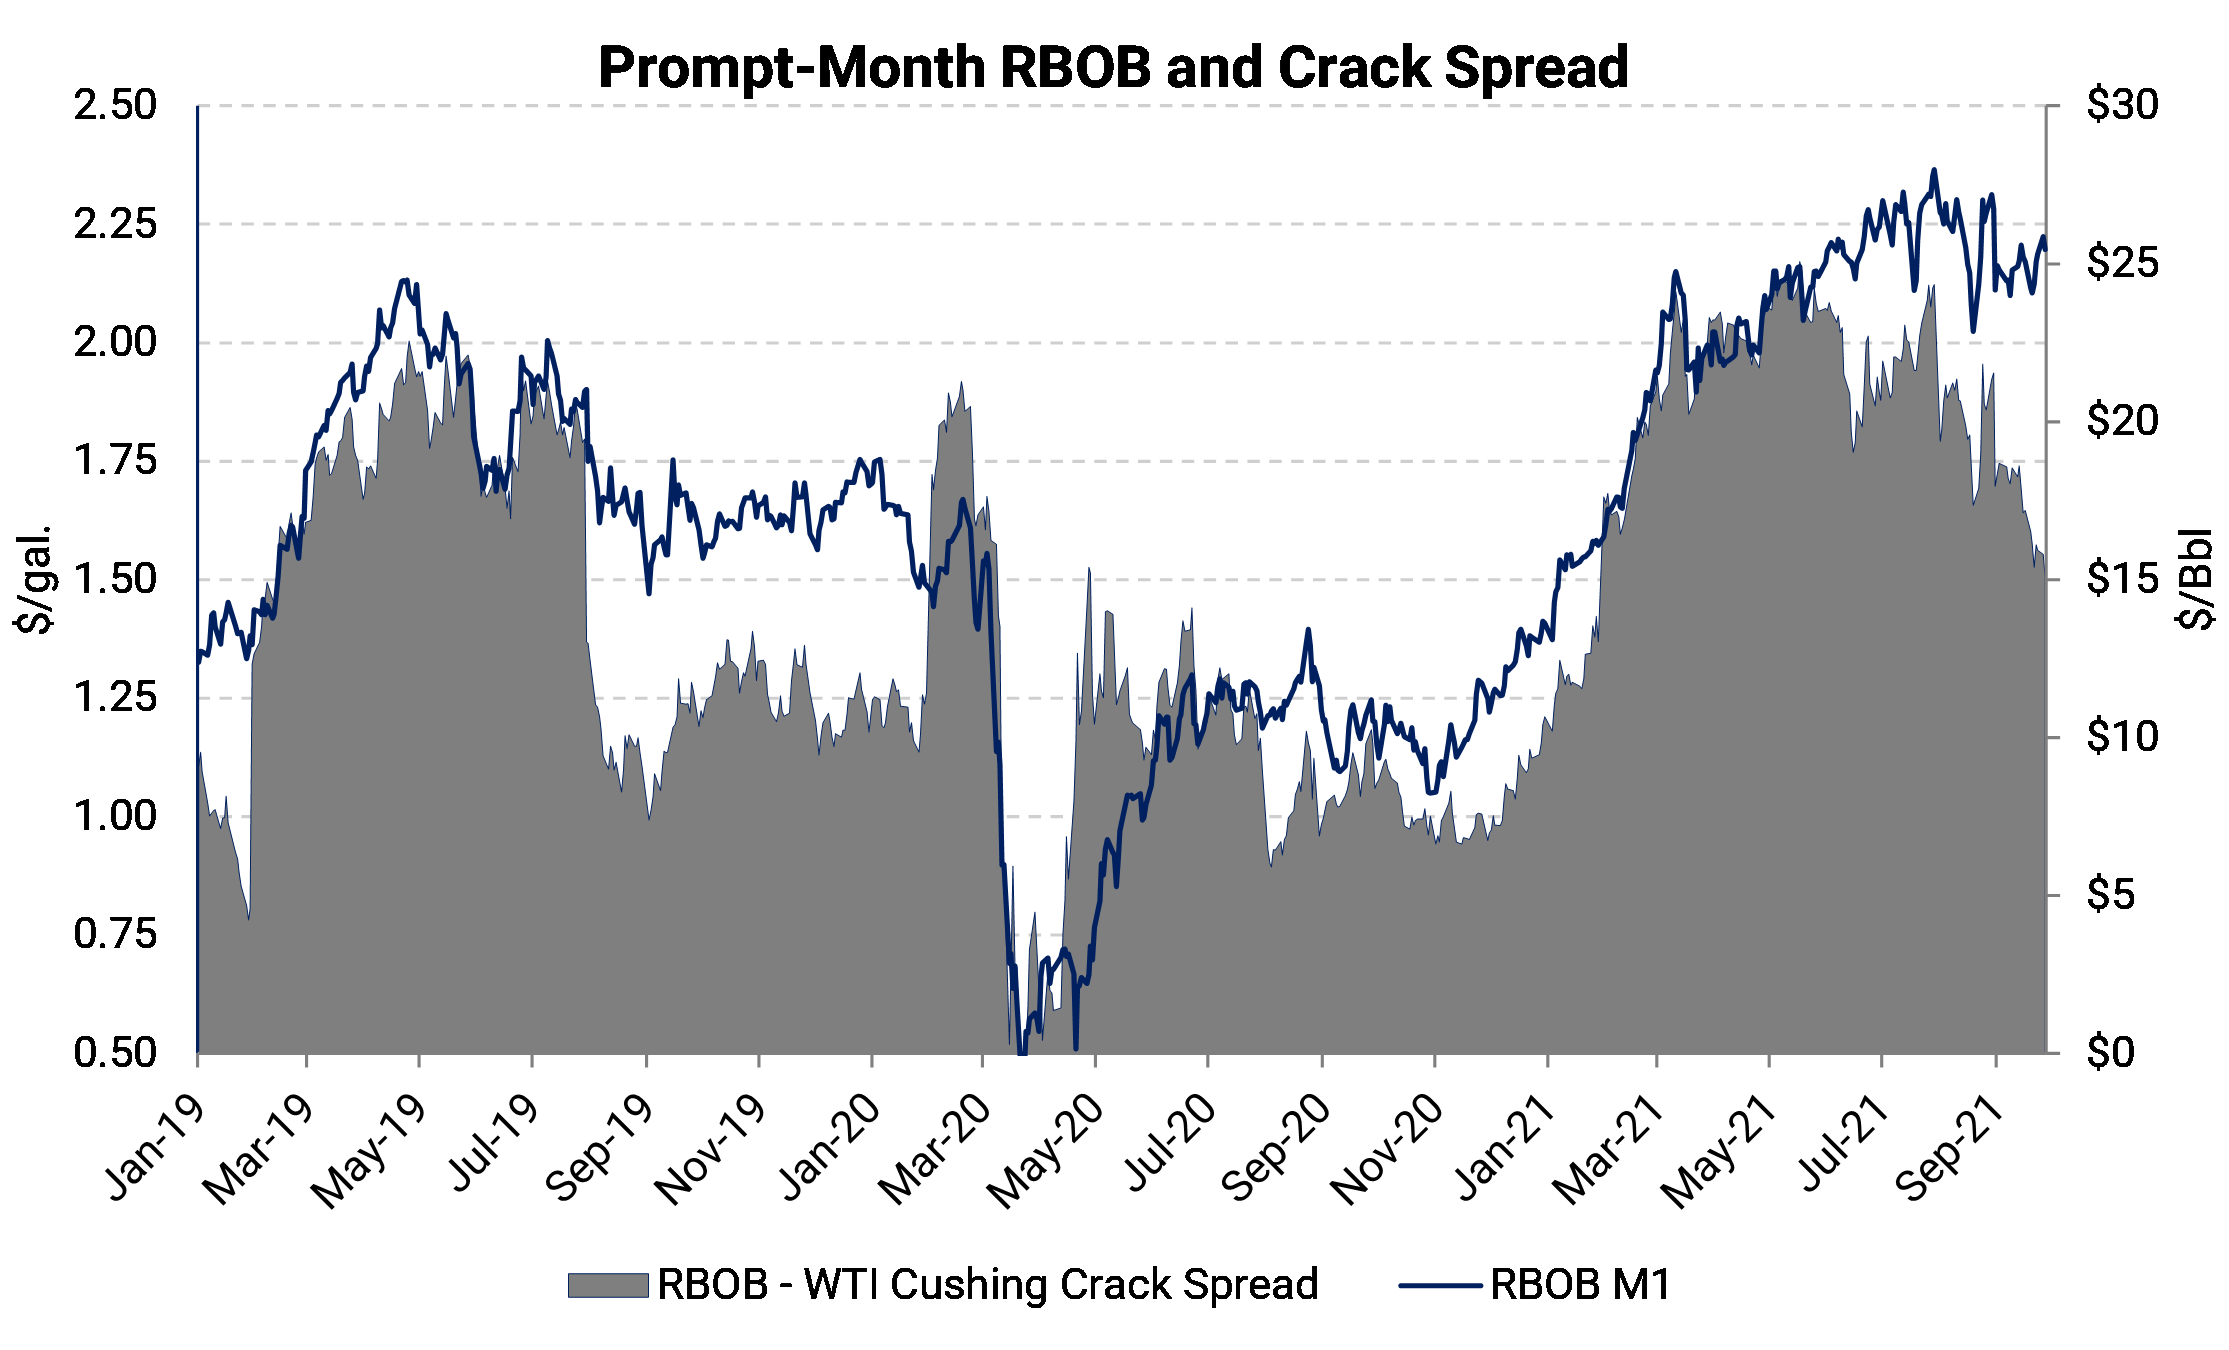
A combination of depleted inventories, limited production, and surging demand has pushed gasoline prices to a multi-year high of around 225 cpg. Prompt-month RBOB is currently at its highest seasonal level since 2014.

Historically, gasoline prices have decreased in September as road traffic wanes. However, prices have risen by 5.46%, or 11.8c, this month. Most of the gain is attributable to higher crude oil prices. The RBOB-WTI crack spread has fallen recently, narrowly mitigating the effect of higher oil prices. In other words, WTI has outpaced the prompt-month gasoline contract.
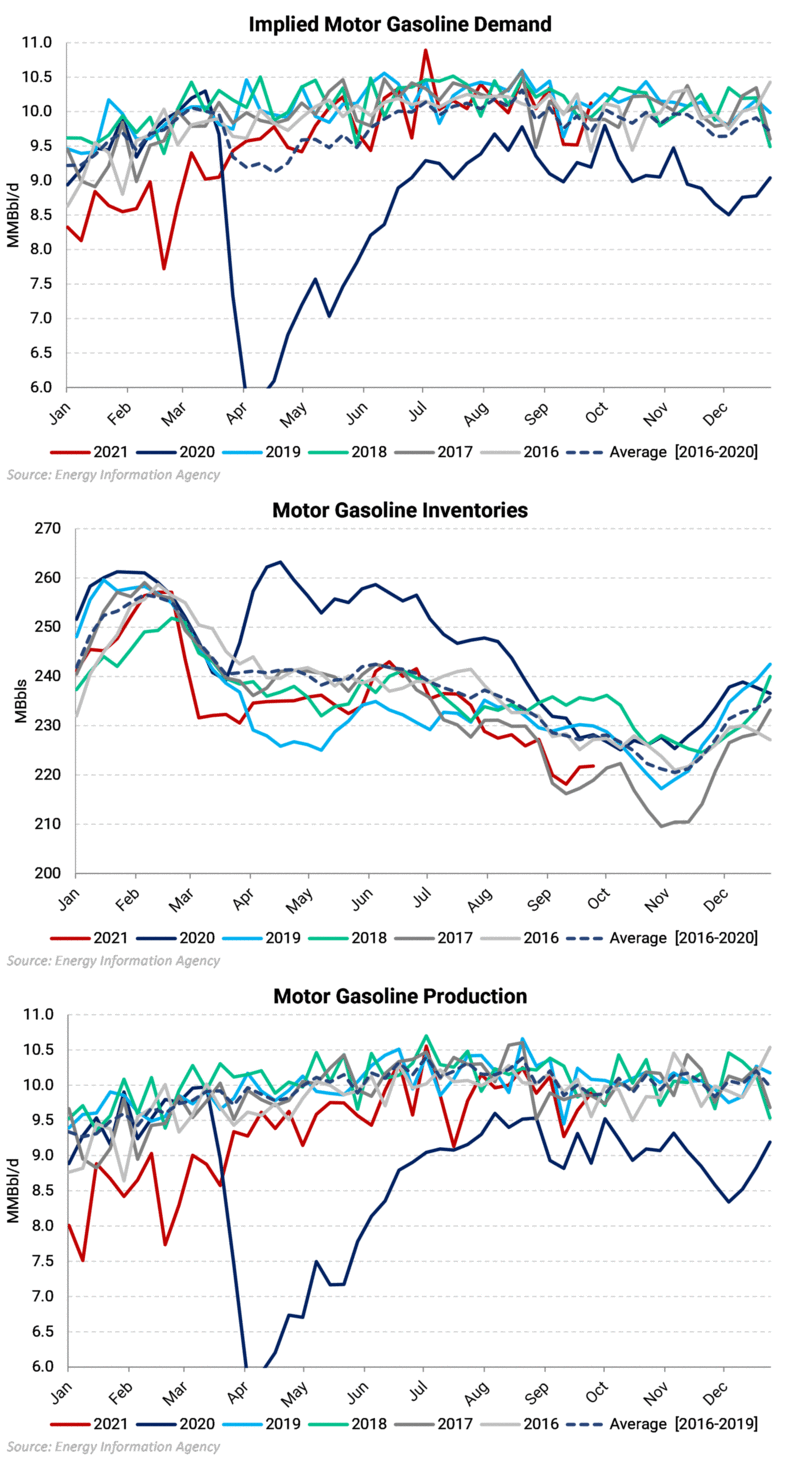
Stats from the Energy Information Agency (EIA) show gasoline demand had mostly recovered to 2019 levels by June 2021. Apple mobility data, which is derived by aggregating the total number of direction (navigation) requests, corroborates this. The Apple mobility data show traffic in the U.S. has surpassed pre-pandemic levels across the country.
The choropleth map below shows the mobility score for each state for September. The score is calculated by using the relative volume of directions requests compared to a baseline volume on January 13, 2020. i.e. A mobility score of 150 means that September traffic was 150% of the total volume observed on January 13 2020.
On the supply side, refinery inputs and gasoline production are still below 2019 levels, and the recent string of hurricanes to hit the Gulf Coast have only worsened these supply woes. Hurricane Ida temporarily knocked out PADD 3 refining capacity, and some of the production disruptions could persist, supporting gasoline cracks. Still, because most refineries in the U.S. are running below capacity, the void created by these hurricane-induced outages can be filled elsewhere, which is exactly what happened. Hurricane Ida knocked PADD 3 (U.S. Gulf coast) refinery utilization rate down to 72% from 92%, and during this time PADD 2 (U.S. Midwest) increased from 88% to 96% and other PADD districts increased also.

The combination of surging demand and limited production have helped deplete U.S. motor gasoline inventories. Motor gasoline inventories are at their lowest level since 2017, and the deficit to the four-year average (excluding 2020) has widened to 6 MMBbls.
If demand remains robust and the U.S. continues to burn through inventories at this clip, crack spreads could have room to rise even further to incentivize refiners to make more of the fuel. Of course, a lot of uncertainty still exists as the U.S. still sees fluctuation in demand due to rising COVID-19 cases, but the supply-demand backdrop is cause for a constructive outlook for gasoline prices.