The expected expansion of U.S. LNG export capacity to 25 Bcf/d by 2028, along with the inherent risks of facility outages and seasonal utilization patterns, may cause natural gas prices to have more fluctuations, with different patterns in summer compared to winter. Market participants should be prepared for more pronounced seasonal swings.
The Henry Hub forward curve as of December 2023 implies a tighter supply-demand balance in the coming years. Futures are priced materially higher farther down the curve, a rather steep upward-sloping curve. The rise in forward prices makes sense considering changing fundamentals; it aligns with planned US LNG export capacity, the main driver of US demand in the coming years.
As the US market becomes even more reliant on LNG exports as a key demand center, there is a possibility seasonal price volatility will increase. The summer strips and, more specifically, fall shoulder-season months could be susceptible to price deterioration, while winter months maintain a healthy risk premium.
Already, future Oct-Jan spreads are seasonally much wider than they had been in history, indicating a combination of strong peak winter risk and weaker summer/fall contract months.
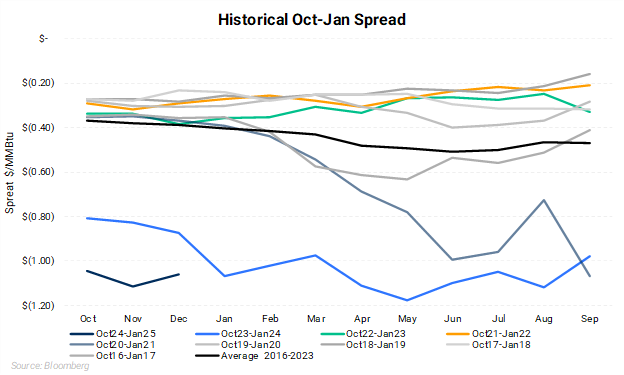
The chart below shows the Oct-Jan spread for each trading year (October through September), going back to 2016. Historically the spread was consistently trading -20c and -40c, barring an outlier year Oct ‘20-Jan ‘21.

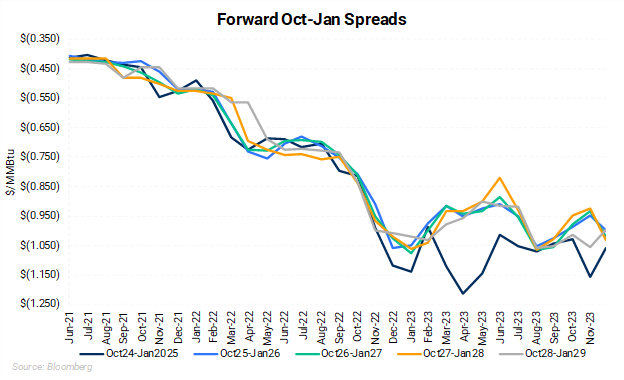
More recently, the spread looks to have fundamentally changed. The next Oct-Jan spread, now Oct ‘24-Jan ‘25, has separated since late 2021 from -$0.425 to -$1.118. And this phenomenon persists if you look farther into the future. The chart below shows that, for the rest of the decade, the Oct-Jan spread is noticeably wider than in years past. Forward pricing has consolidated near -$1.05 after steadily deteriorating since 2021.

Why is this happening? We believe it is consistent with more export demand in and beyond 2025, and that export demand will be more seasonal than it had been in the past.
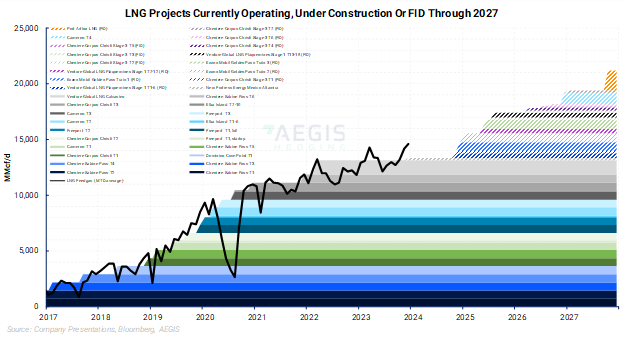
By the end of 2025, the US is expected to have roughly 21 Bcf/d of LNG export capacity. That number increases another ~4 Bc/d to 25 Bcf/d by the end of 2028 according to data published by the EIA.

As the number of facilities increases, the risk of planned and unplanned outages also increases. The US and global natural gas market felt the impact of an unplanned outage from June 2022 through February 2023 when Freeport LNG was offline. The 2 Bcf/d facility was offline for eight months after the plant explosion. From January through May 2022, Freeport LNG feed gas supply averaged 1.77 Bcf/d. Assuming the plant maintained that supply level, the 238 days the plant was offline reduced domestic demand by roughly 420 Bcf.
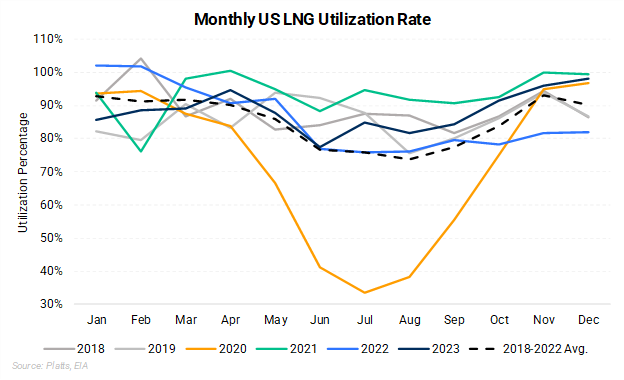
Since 2018, utilization rates for LNG export facilities noticeably declined across the summer months, bottoming out in the third quarter. In the five years from 2018-2022, utilization rates during summer (Apr-Oct) averaged 81% while winter utilization rates (Nov-Mar) averaged 92%. This is visualized in the chart below.

Two of the main reasons for the dramatic drop-in summer utilization rates are maintenance and efficiency loss due to heat. By 2028, assuming utilization rates stay in line with 2018-2022, Winter potential demand for LNG will outpace that of Summer by 2.75 Bcf/d. The sheer size of the nameplate demand loss in Summer will act as a drag on price, while a healthy Winter premium should remain.
Globally, LNG is a seasonal fuel, as most is burned in the northern hemisphere in winter. Locally, in the US, LNG demand can dwindle in the summer for the reasons described above. Combine these two, and we see a structural change in the natural gas market that could be contributing to a wider Oct-Jan and Summer-Winter price spread.