Is the market already pricing in a frigid winter? How else do you explain rallying gas prices and extreme call-skew, despite weakening storage level forecasts? Maybe some of the optimism surrounding JKM and TTF prices is spilling over into U.S. gas prices.
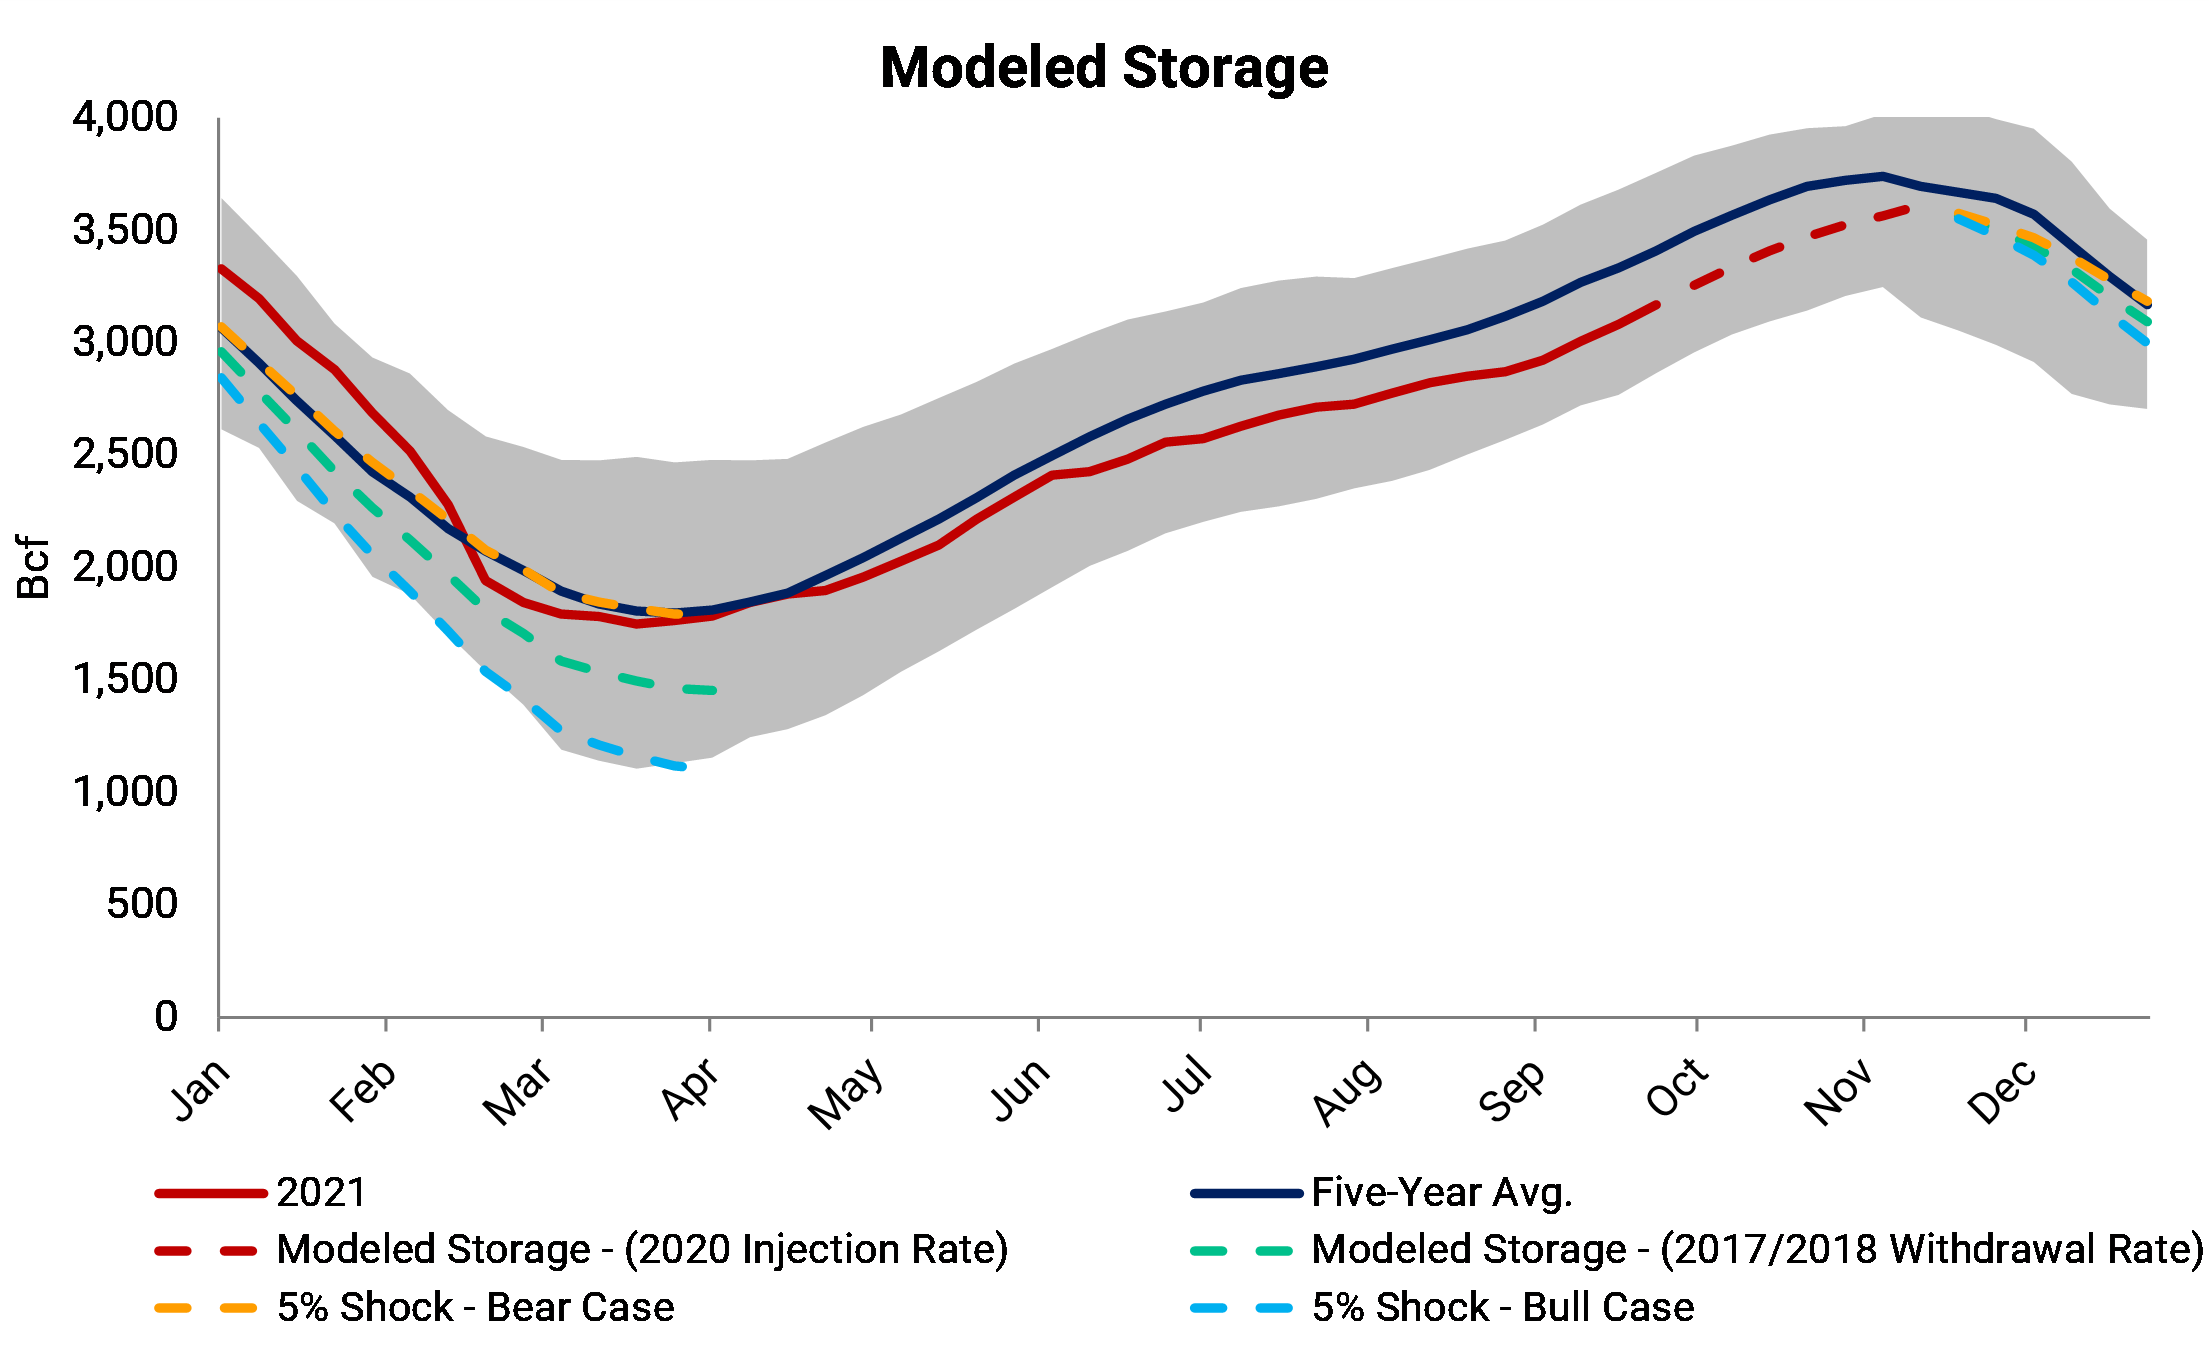
This week we looked at the current trajectory of inventory levels and modeled three weather scenarios. We found that it would take a warm winter for U.S. inventories to return to the five-year average by withdrawal-season end.
Winters have been skewed toward the warmer end of the historical range over the last several years. A normal winter compared to, say, the previous five years would put U.S. inventories near the five-year average.

In layman’s terms, our inventory model calculates and projects a weather-adjusted supply-demand balance. The model works by finding analogous years since 2012. It finds regression formulas for each withdrawal/injection season, finding the relationship between storage changes and the number of pop-weighted degree days.
Inventories are likely to start winter at around 3.611 Tcf, by our estimate. That mark would be the second-lowest starting point in the last five years, but not dangerously low. It would be a deficit of 143 Bcf to the five-year average.
In the last several weeks, the supply-demand backdrop has shown signs of weakening; October weather is expected to remain mild. This October weather actually added around 100 Bcf to our storage projections for November.
We found that the 2017/2018 injection season was a suitable analog for the current supply-demand balance, on a degree-day-normalized basis. In our base case, gas inventories would finish the withdrawal season at 1.453 Tcf, the third-lowest starting point to an injection season in the last five years.
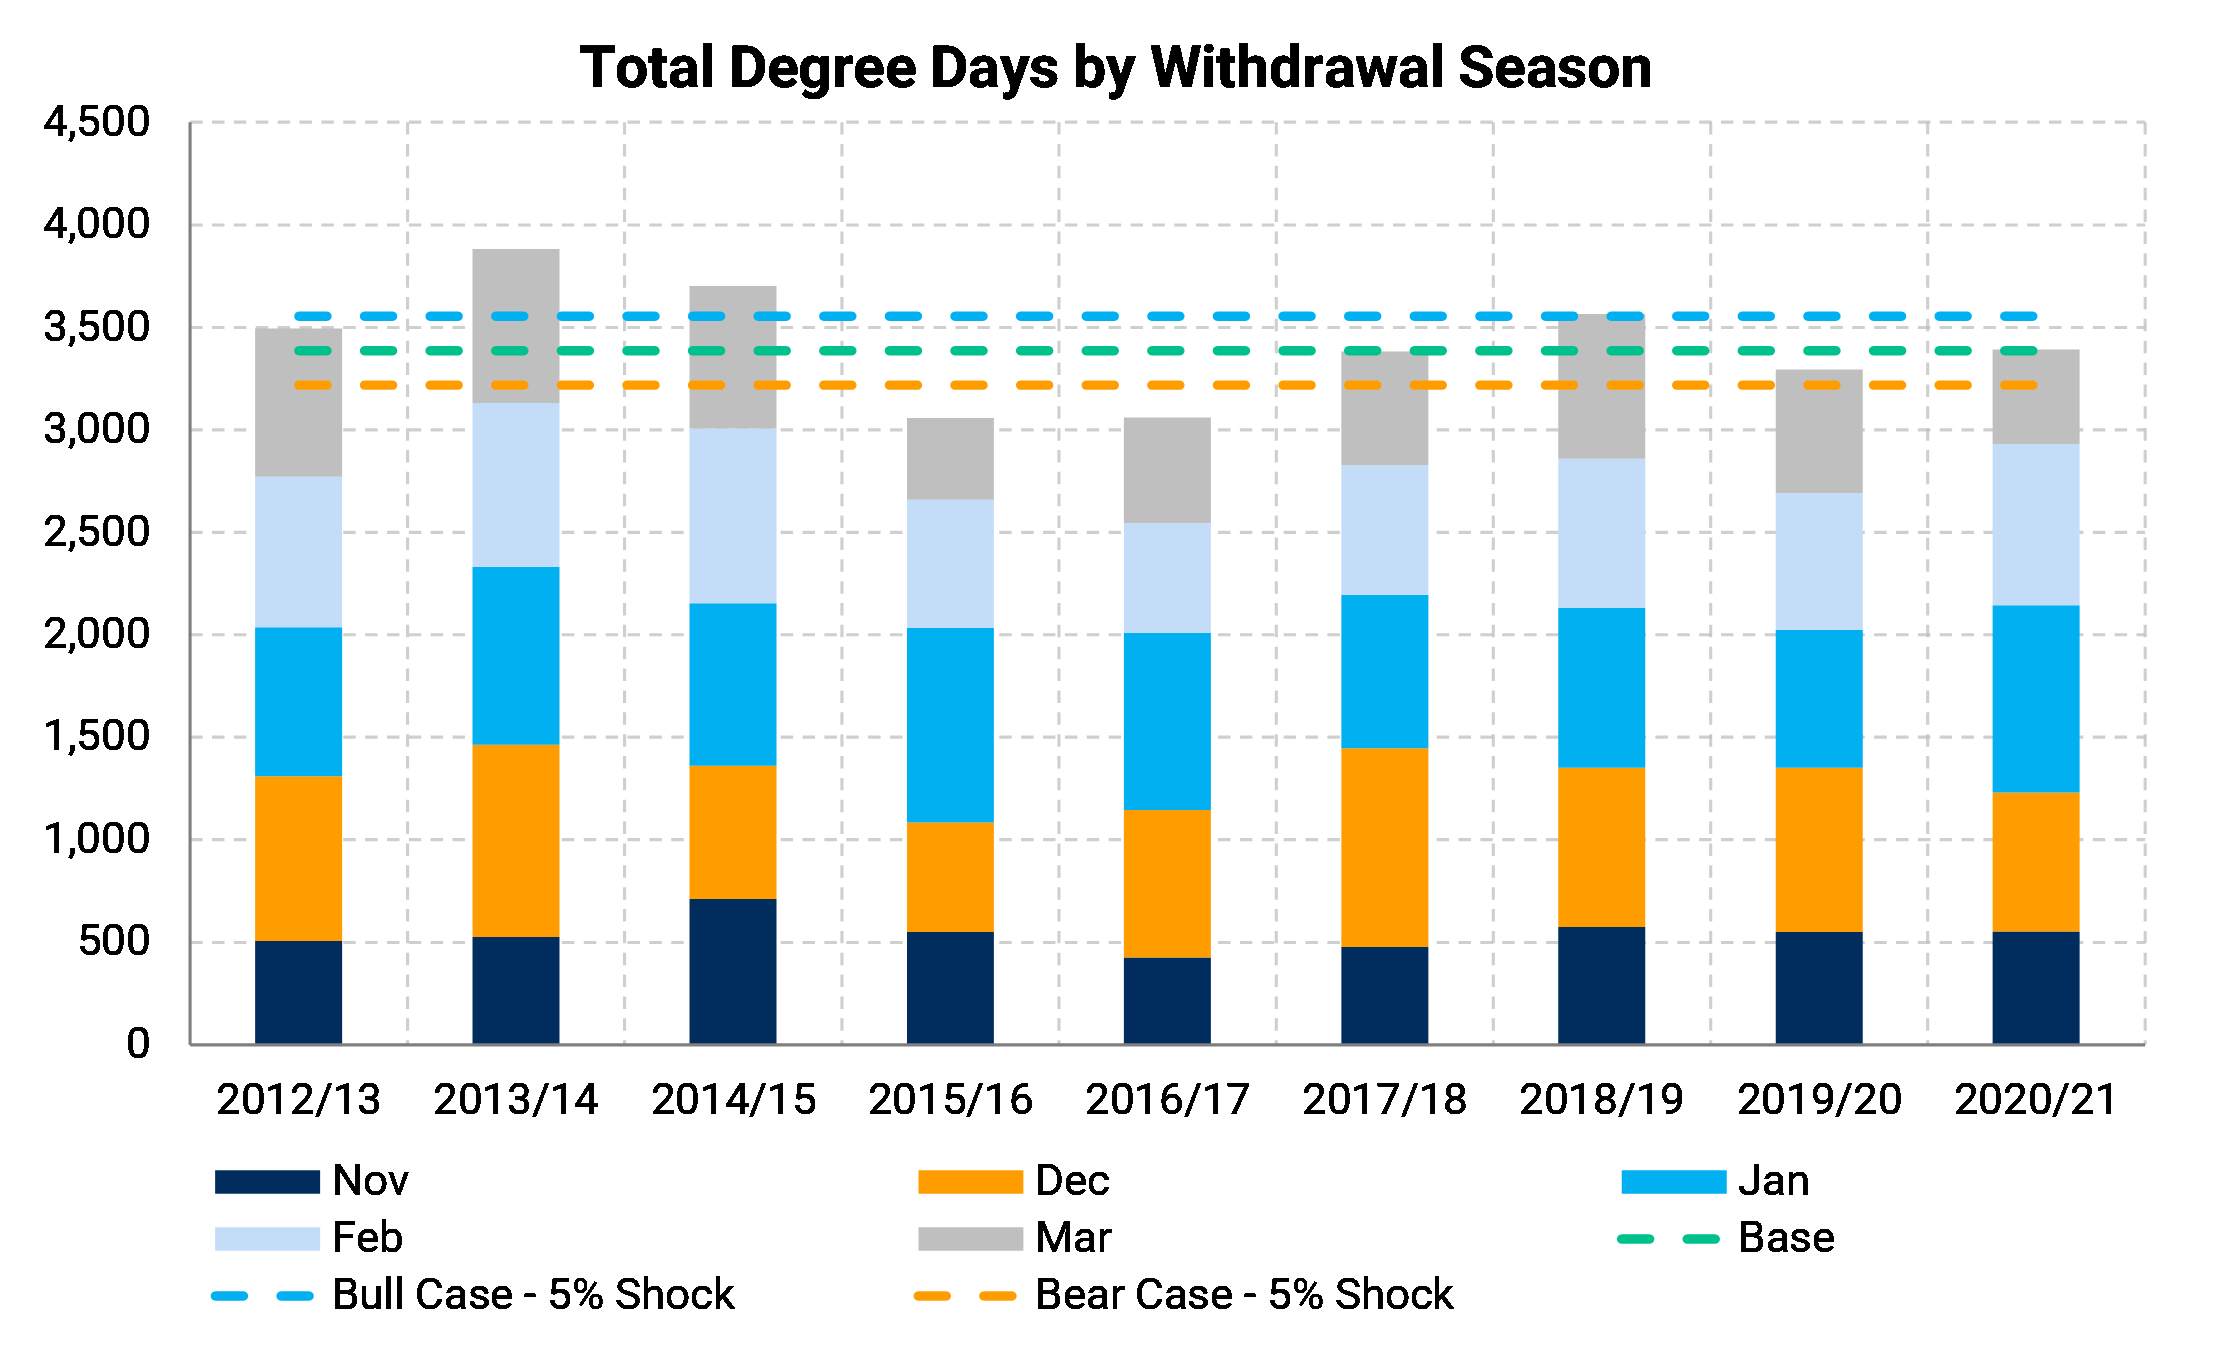
We shocked the total degree day total by 5% to the upside and downside to see how storage would be affected. In our bull case, inventory levels would finish at 1.103 Tcf, which would be the third-lowest starting point in the last decade. If this were to happen, that would justify current forward prices, levels not seen since 2014. However, it’s important to point out inventories reached 0.824 Tcf in 2014, nearly 280 Bcf below even our bullish storage scenario. In addition, that was the coldest winter in recent memory and ranked as the 29th-coldest pop-weighted in the last 100 years. A polar vortex was also partly to blame for the extremely low inventory levels and high prices.
In our bearish forecast, inventory levels would close the deficit to the five-year average by year-end; stocks have been trending that way already in the last several weeks. For example, the deficit has gone from 235 on September 3 to 176 Bcf for the week ending October 1. Under our bearish-5% scenario, inventories would stay near the five-year average once the deficit is closed and end the withdrawal season at 1.790 Tcf.

The chart above shows the total degree days by withdrawal season. Our base case is very similar to last year’s winter from a degree-day perspective, our bull case is near 2018/2019 winter, and our bear case is closer to the 2019/2020 winter. These numbers are fairly conservative, especially given the “climate drift” observed over the past several years. Three of the top ten warmest winters have occurred in the last ten years.
In conclusion, the gas market is tight, though probably not as much as you would expect when looking at current prices. However, it does look like the recent increase in price has loosened the supply/demand balance, but that could also be due to weakening demand during a “shoulder” month. Weather will be the primary driver behind both inventory levels and price this winter. Still, if inventory levels approach the five-year average, Henry Hub prices would likely have more downside risks than upside from current levels.