|
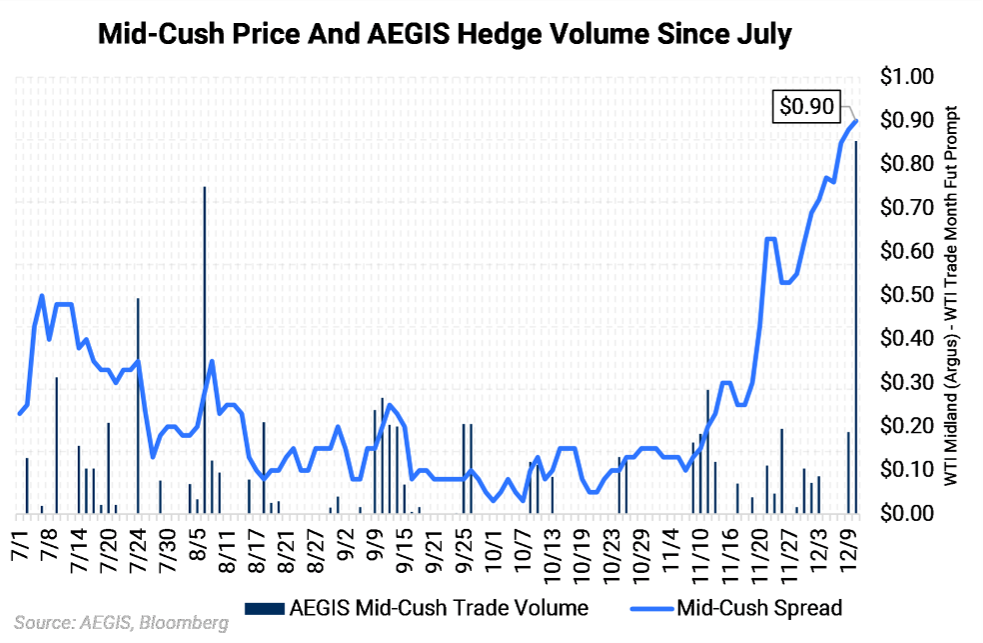
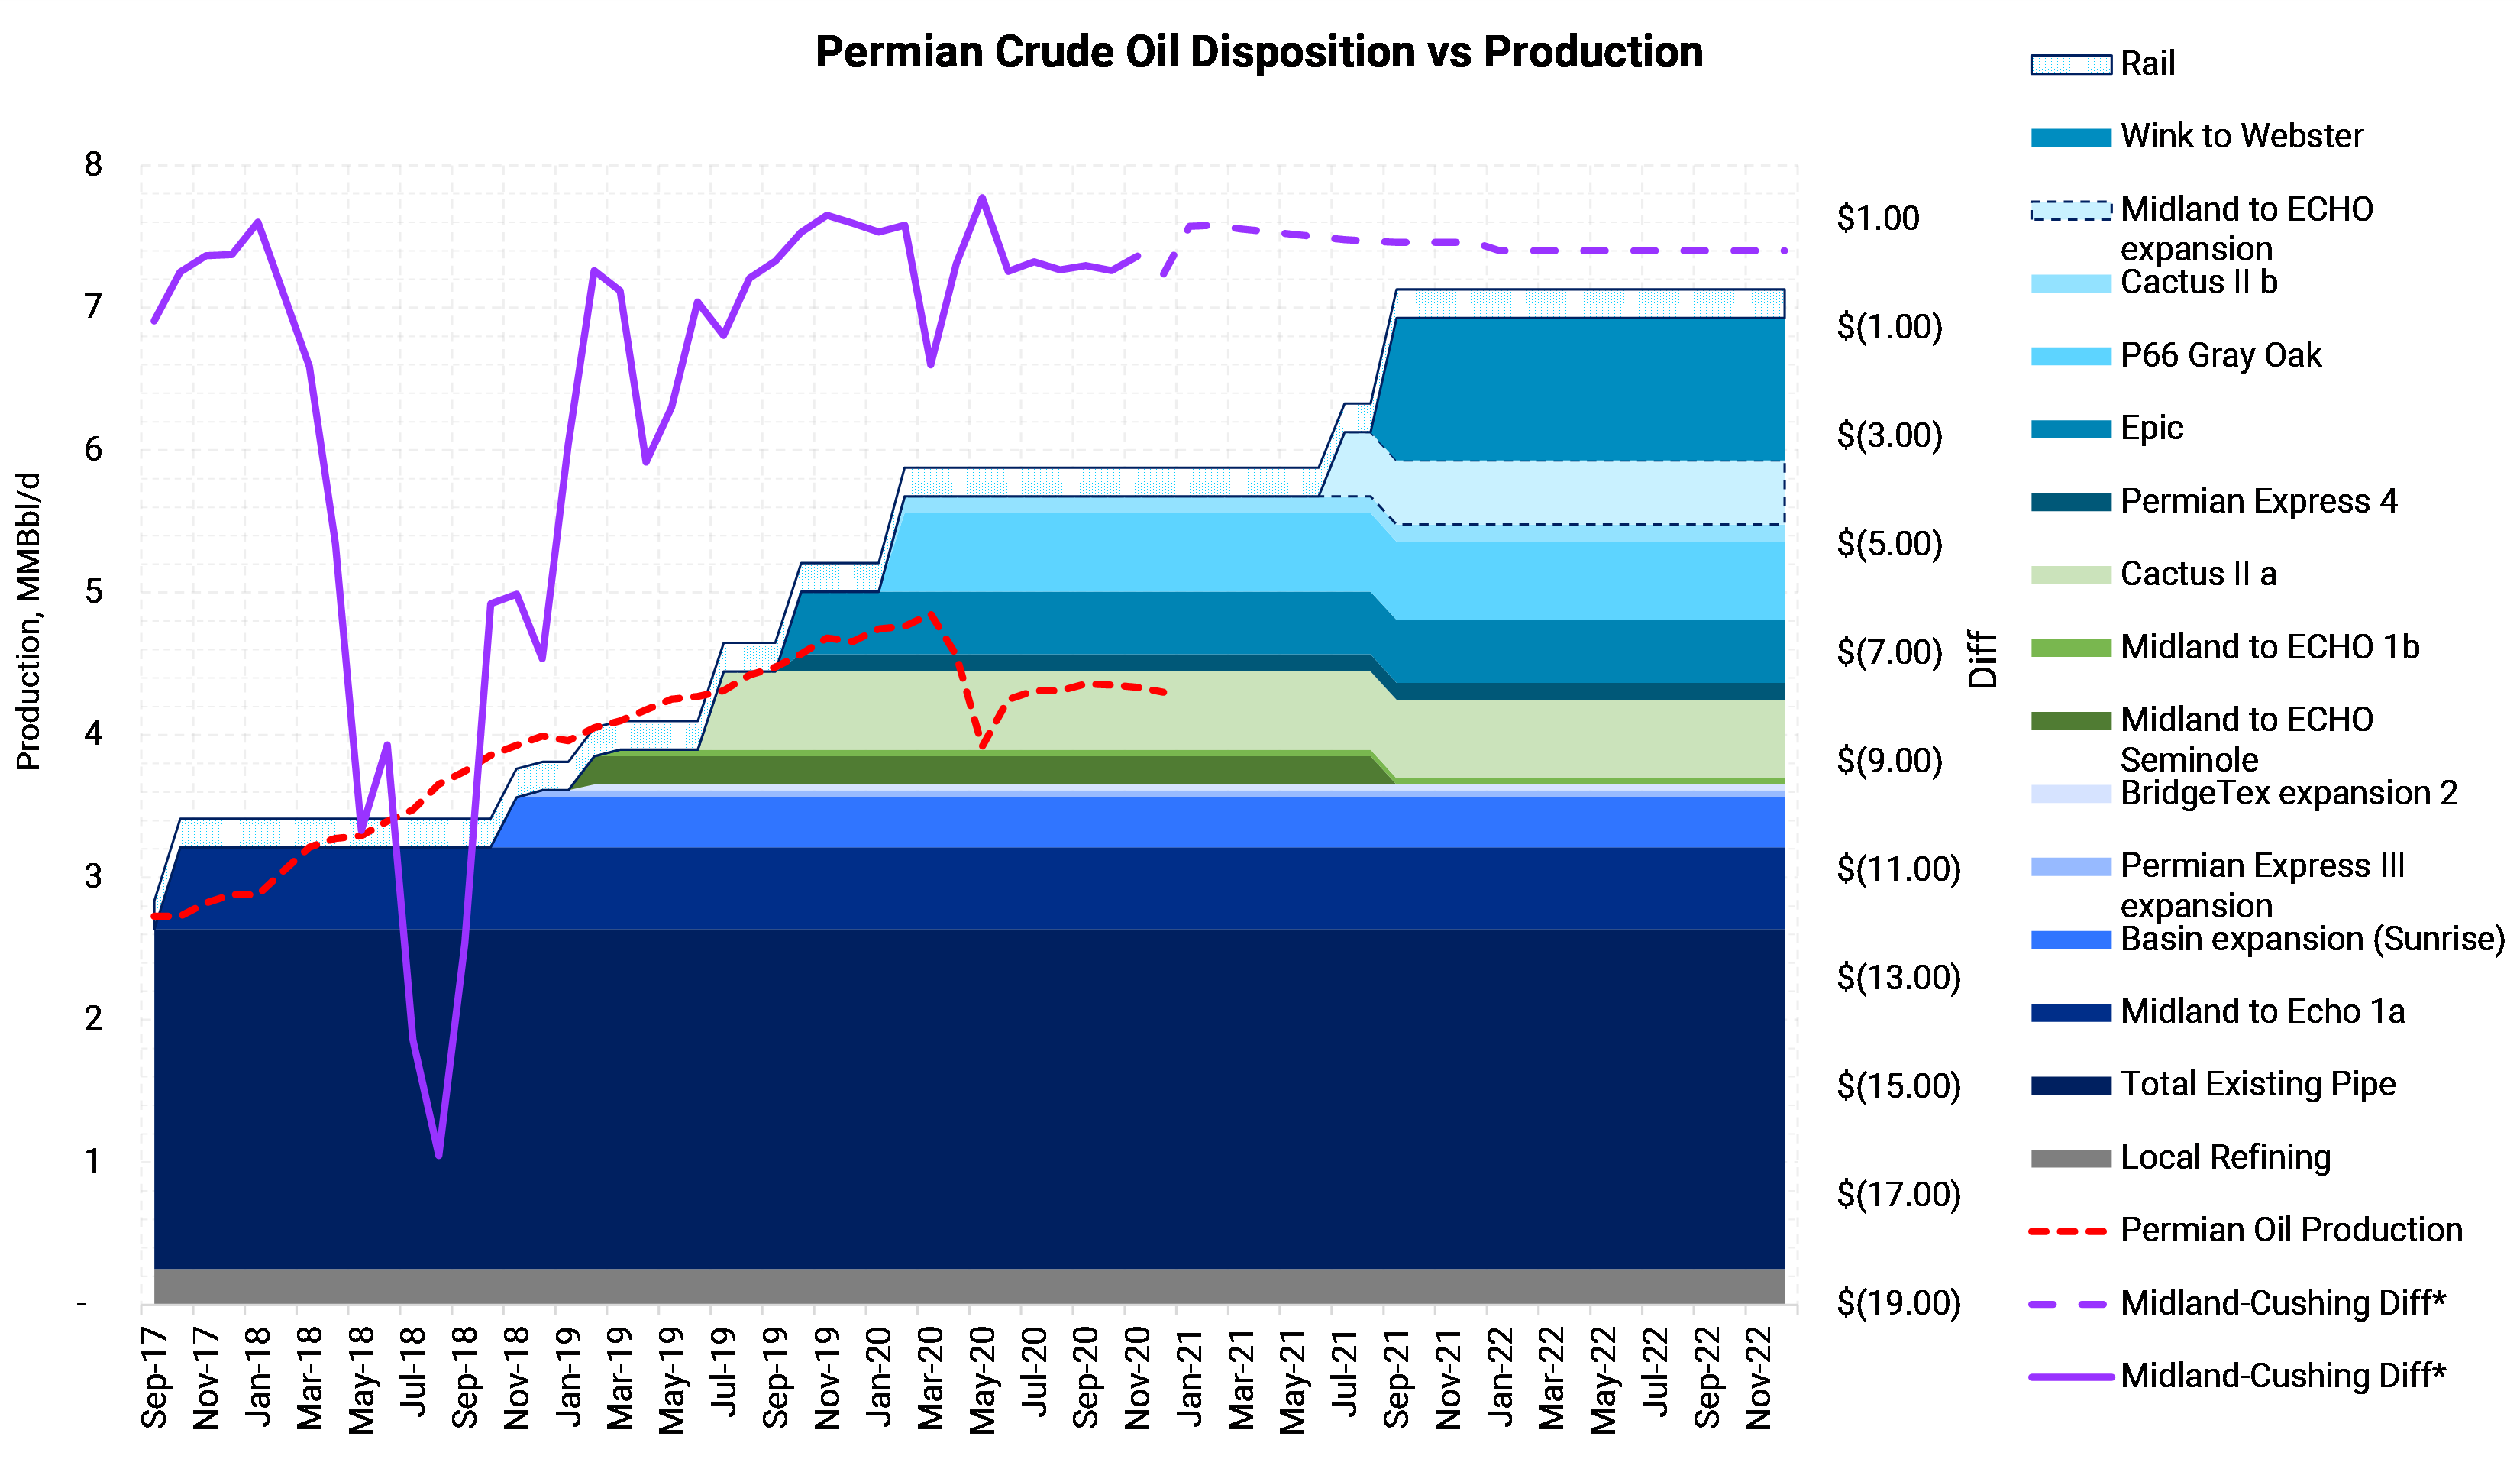
Midland has reasons to continue trading above Cushing as this year's drop in production has resulted in unused pipeline takeaway capacity out of the basin. The situation may persist for years. The large infrastructure buildout from late 2018 to early 2020 provided ~2.5 MMBbl/d of additional takeaway capacity. The Permian Crude Oil Disposition chart highlights the dramatic improvement (purple line) in Mid-Cush between 4Q 2018 and 1Q 2020. The spread has since settled in between $0.00 and +$0.50 for much of 2020, until recently.
|
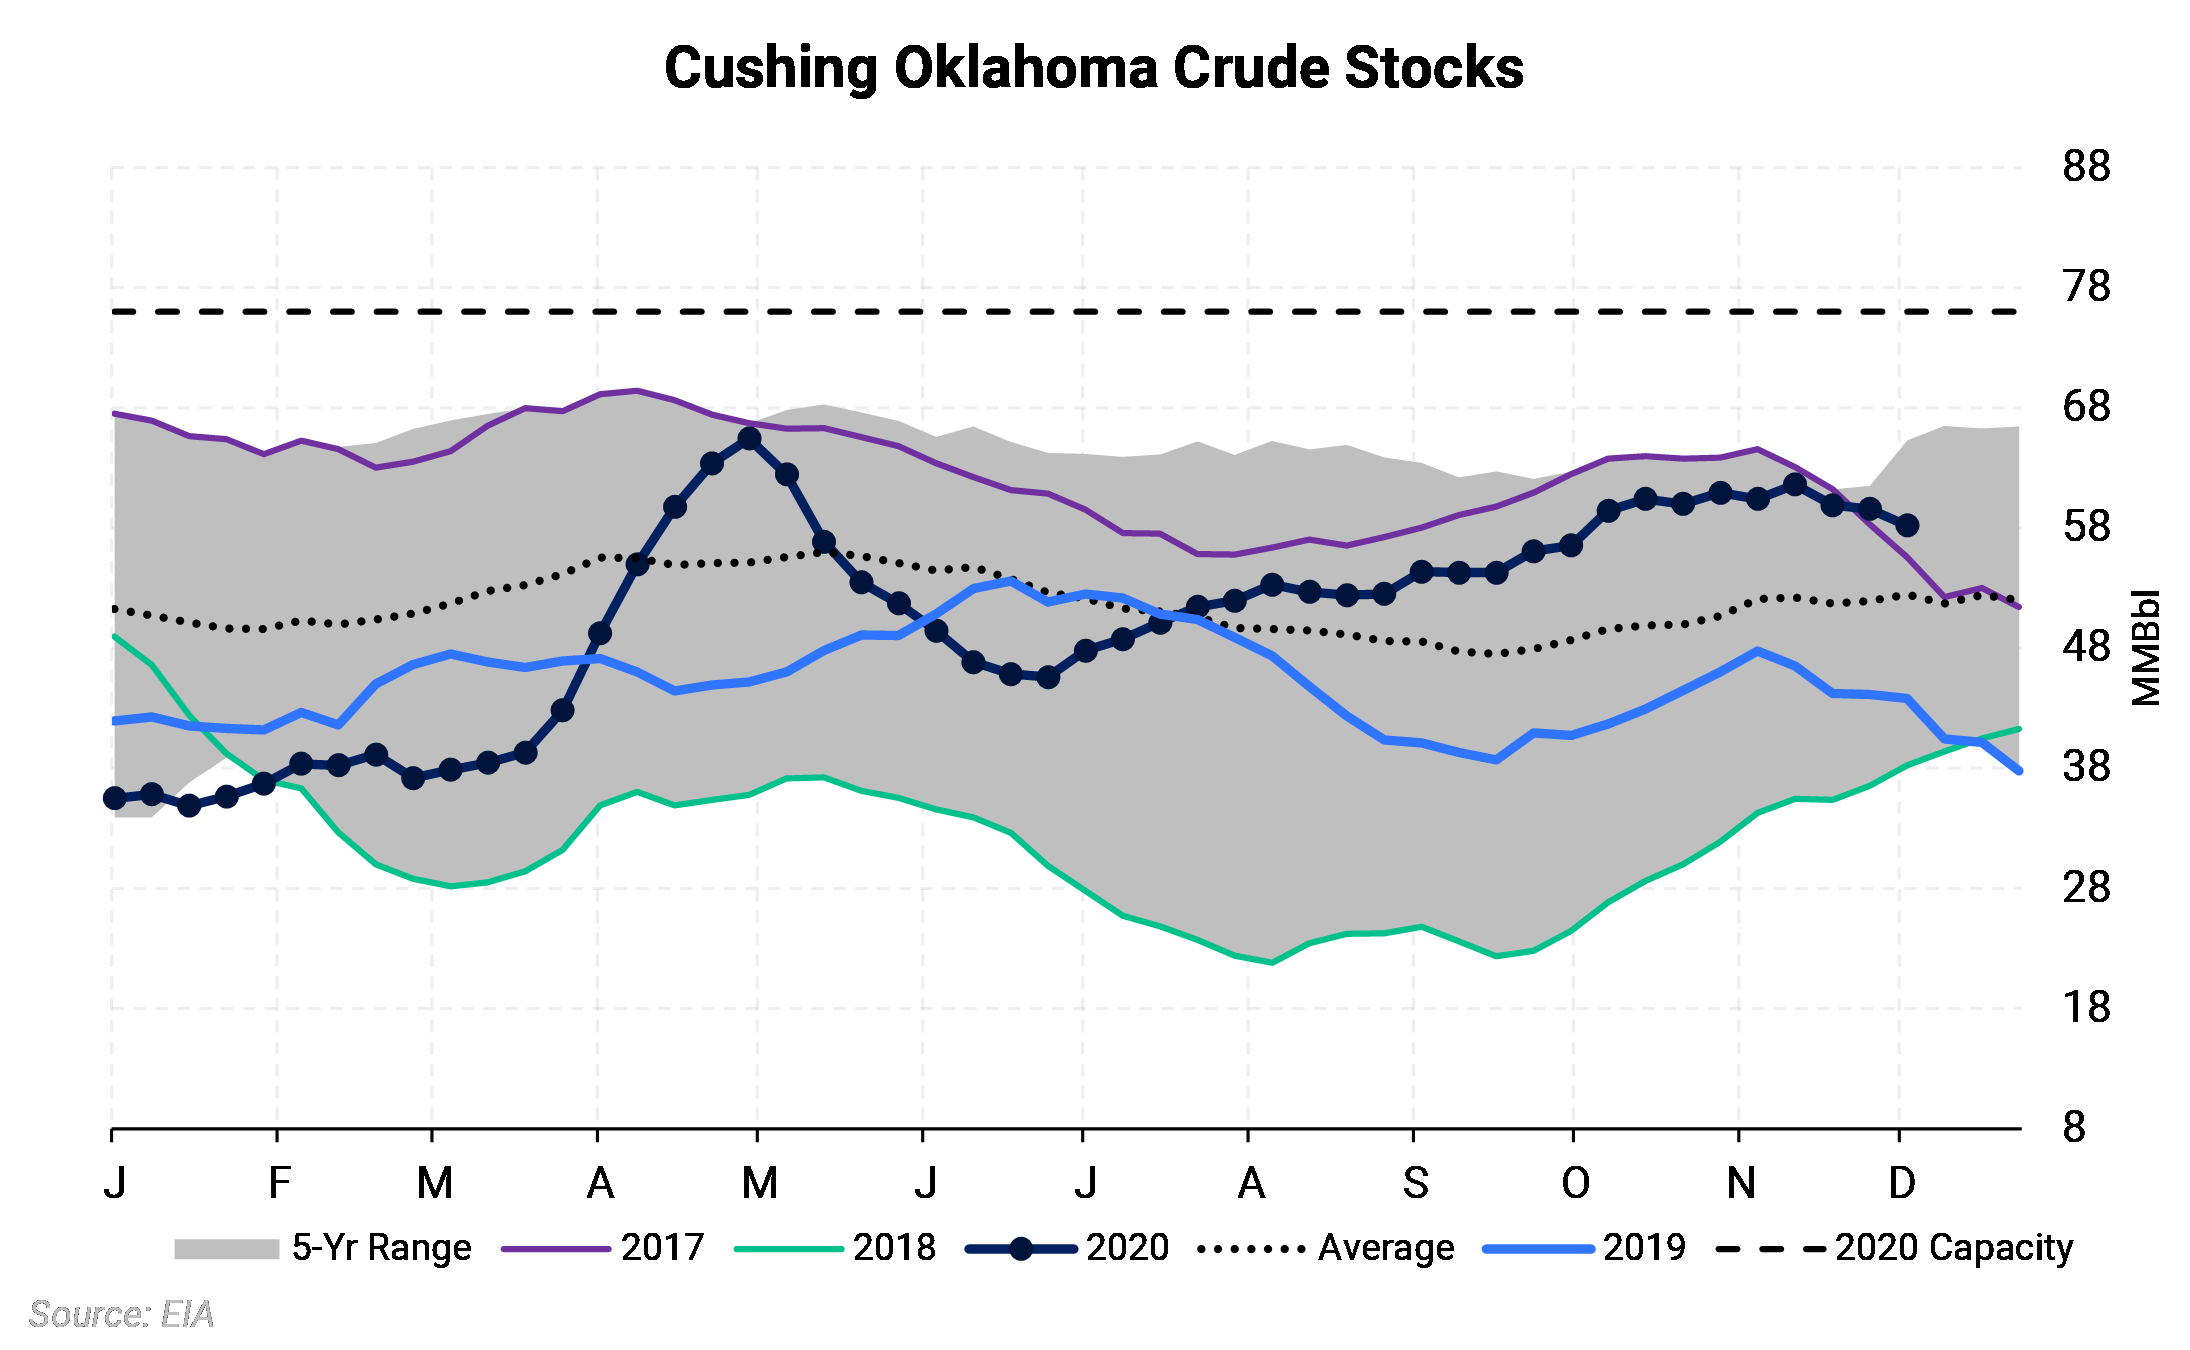
If WTI Cushing were to weaken, it could help Mid-Cush rise to a higher premium. Crude inventories at Cushing have been near the top of the five-year average for a few months. The last time Cushing storage reached near this level was during the infamous negative WTI pricing regime of late April when there was fear of running out of storage space. Cushing storage is again high, which could weaken WTI Cushing prices. However, the storage facilities are unlikely to reach tank tops, because a small drop in WTI Cushing prices would encourage more oil to flow to other markets, such as the Gulf Coast. |


