Gas inventories are a major (on some days, largest) source of supply in the winter. A storage deficit this year raises the risk of extremely high prices this winter
- The storage deficit present in the market has contracted significantly, although it remains a risk to supplies this winter.
- Natural gas inventories were expected to start winter at a low level due to hot weather in May-August
- However, due to mild weather this fall and increased gas production, inventories are expected to begin winter at a relatively normal level
(November 3, 2022 – AEGIS publishes the main charts and figures below as a weekly reference article. This article introduces the materials.)
There is a storage deficit at this moment, but not as pronounced as earlier this summer
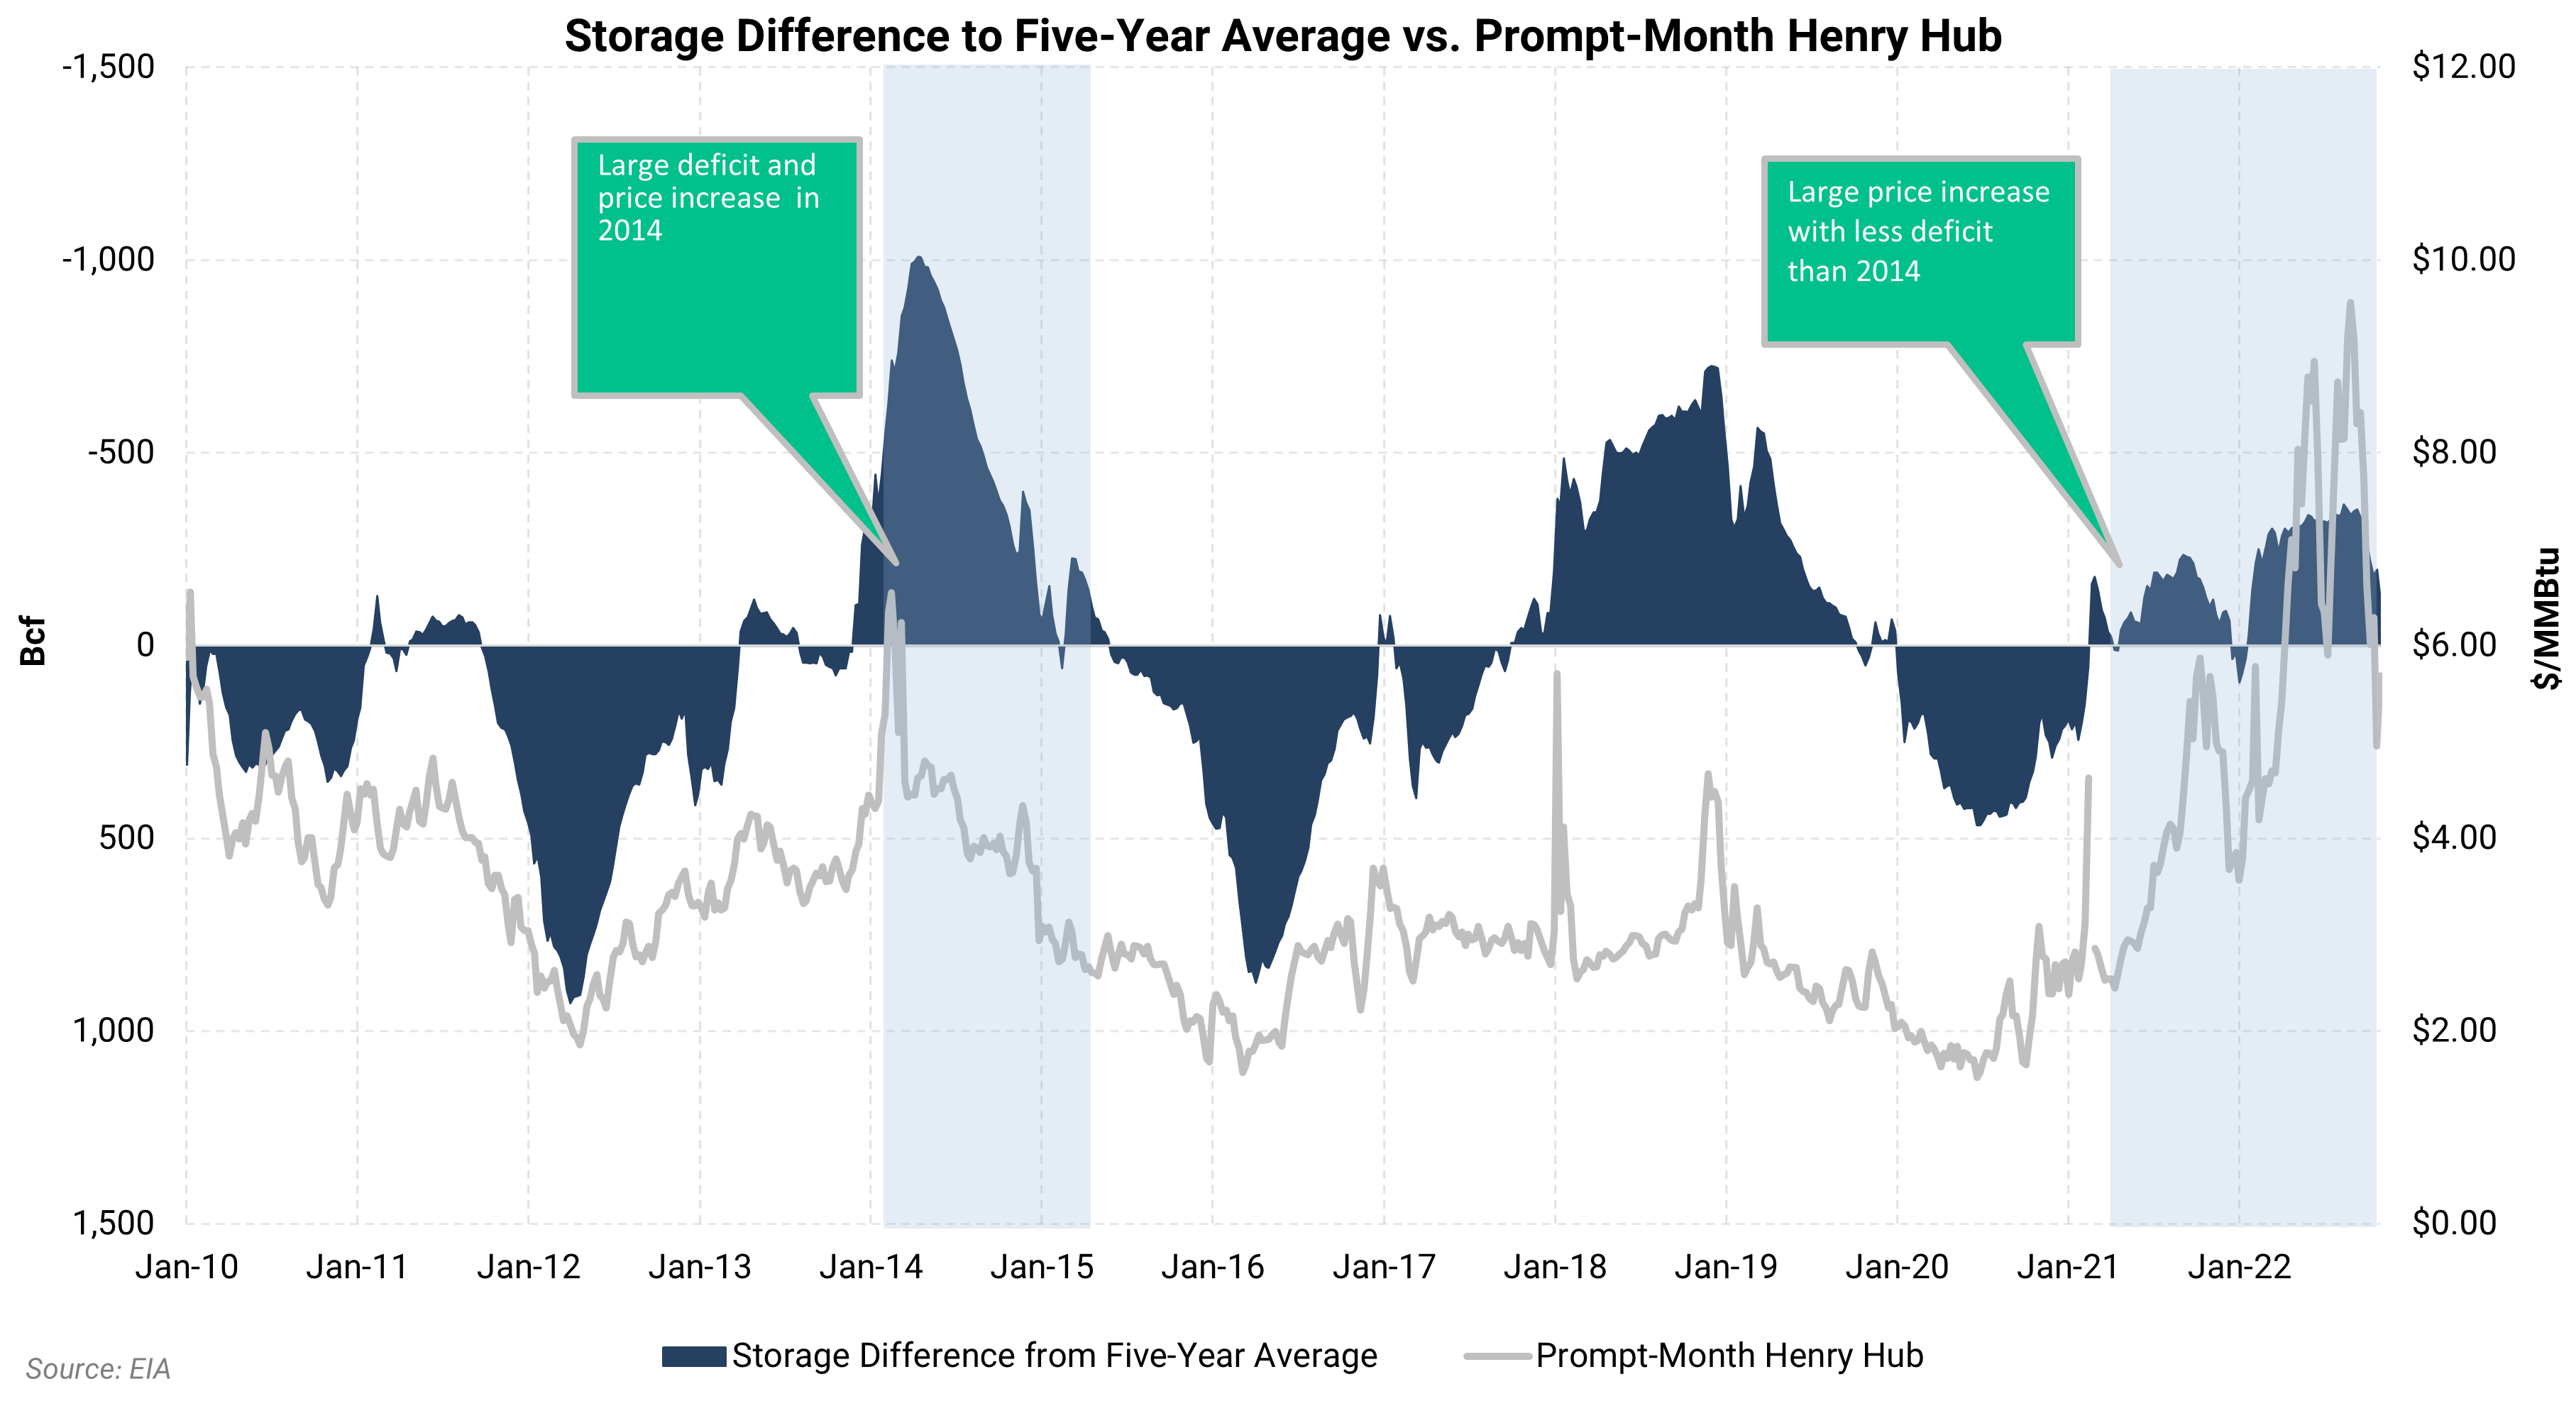
- The chart below displays the storage deficit or the difference between current natural gas inventories and the five-year average. Note the reversed values on the left axis, where a larger deficit (more-negative value) is placed higher on the chart. We do this to show how a storage deficit is correlated with higher gas prices. The deficit, now at -135, while relatively large, has shrunk by more than 100 Bcf in the past several weeks.
- On the right axis, we show the prompt-month Henry Hub price going back to 2010. Shorter-term trends in natural gas prices are often driven by the level of storage relative to the five-year average.
- There is a positive correlation between the storage deficit and the price of natural gas. As storage deficits increase, prices tend to rise.
- It is important to look at the direction of the trend as well as the absolute level. The peaks and bottoms of the market often coincide with peaks and bottoms in the spread between storage and the five-year average.
- In 2014, a 1000 Bcf deficit in the market led to significantly higher prices. The winter-time deficit was mostly created by the infamous “Polar Vortex” winter, but the deficit although small had existed since the previous summer. A comparable situation is occurring now; however, the deficit amount is not (yet) as extreme.
- Why were prices more stable in 2018 despite a large storage deficit? First, prices did spike during a short-lived cold spell. However, gas production was expanding quickly. Further, the number of operational gas rigs peaked that year, suggesting more growth was coming.

A storage deficit is reliably associated with higher prices
The greater the storage deficit, the greater the chance for higher prices and price volatility.
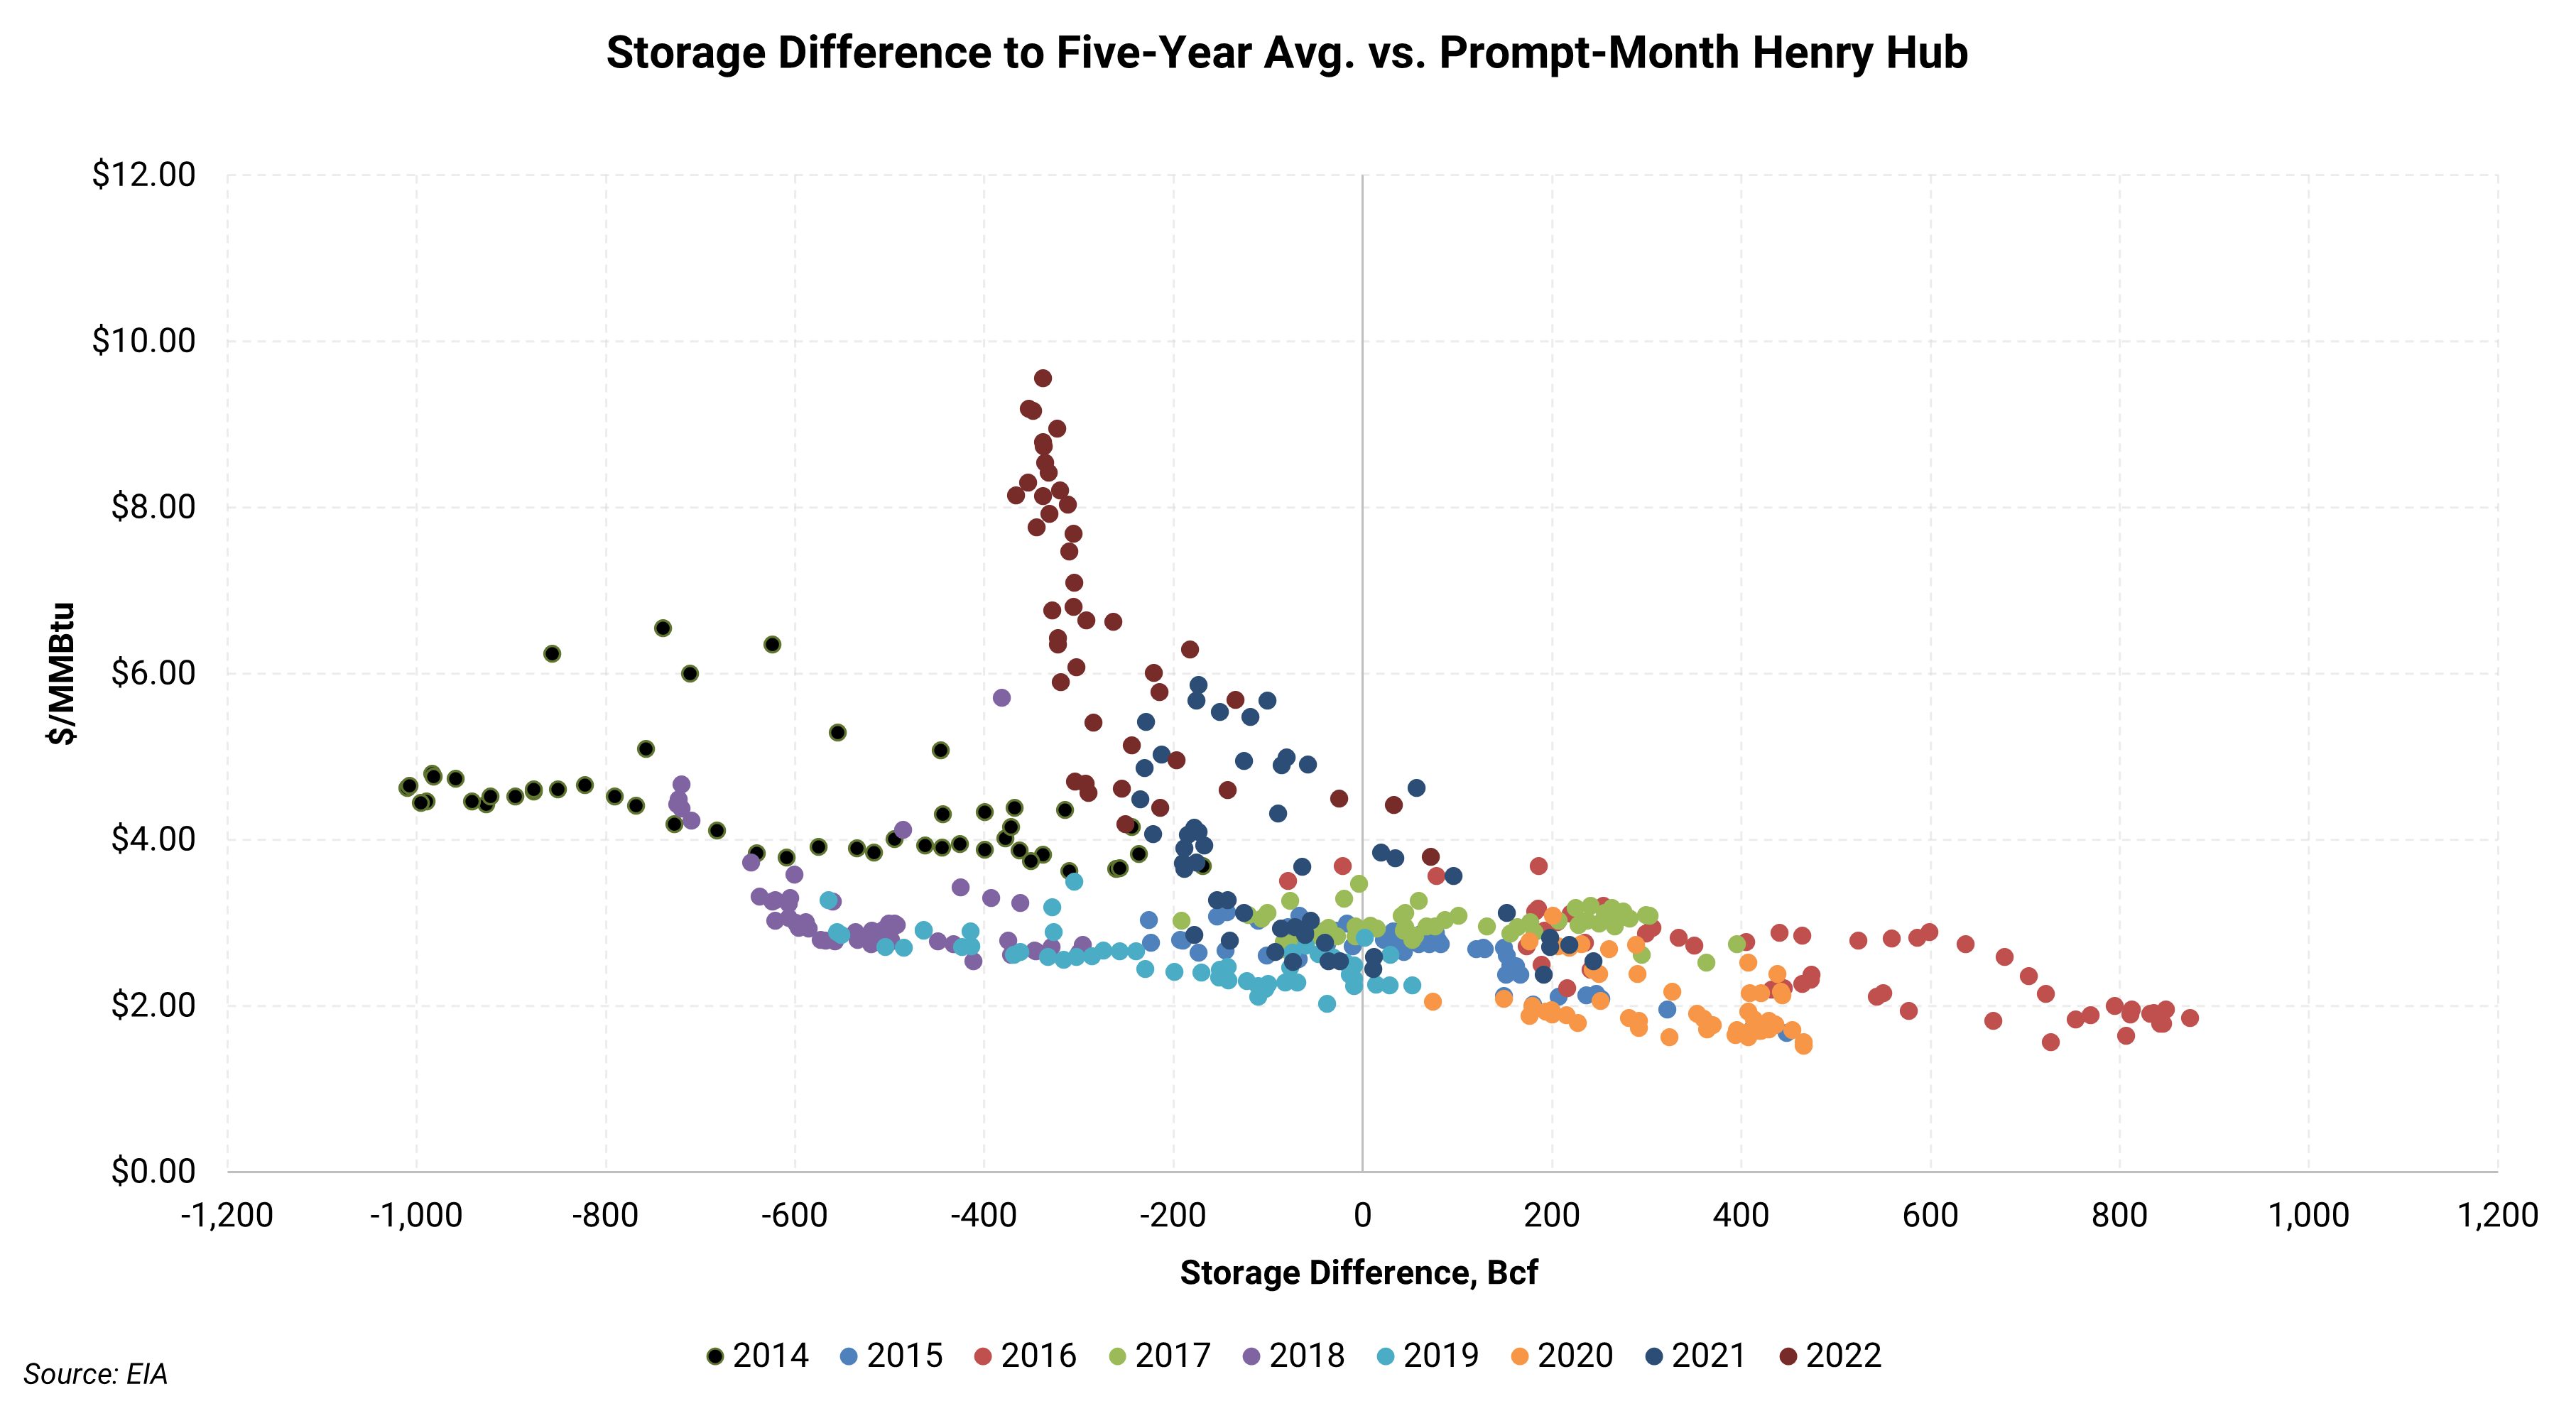
- The chart below shows the relationship between the storage deficit and the prompt-month Henry Hub futures price.
- As the storage difference goes below zero, the dispersion of the data increases, showing how an undersupplied market tends to correct with higher prices while a well-supplied market is generally free from price shocks.
- In most years, prices gradually change as the market gets more information about inventories. However, in 2022 the chart shows an exponential increase in price while the storage deficit has averaged around -300 Bcf

After adjusting for weather, the supply and demand balance has flipped to indicate looser conditions this fall
A series of consecutive above-average storage builds has removed the tightness from the market
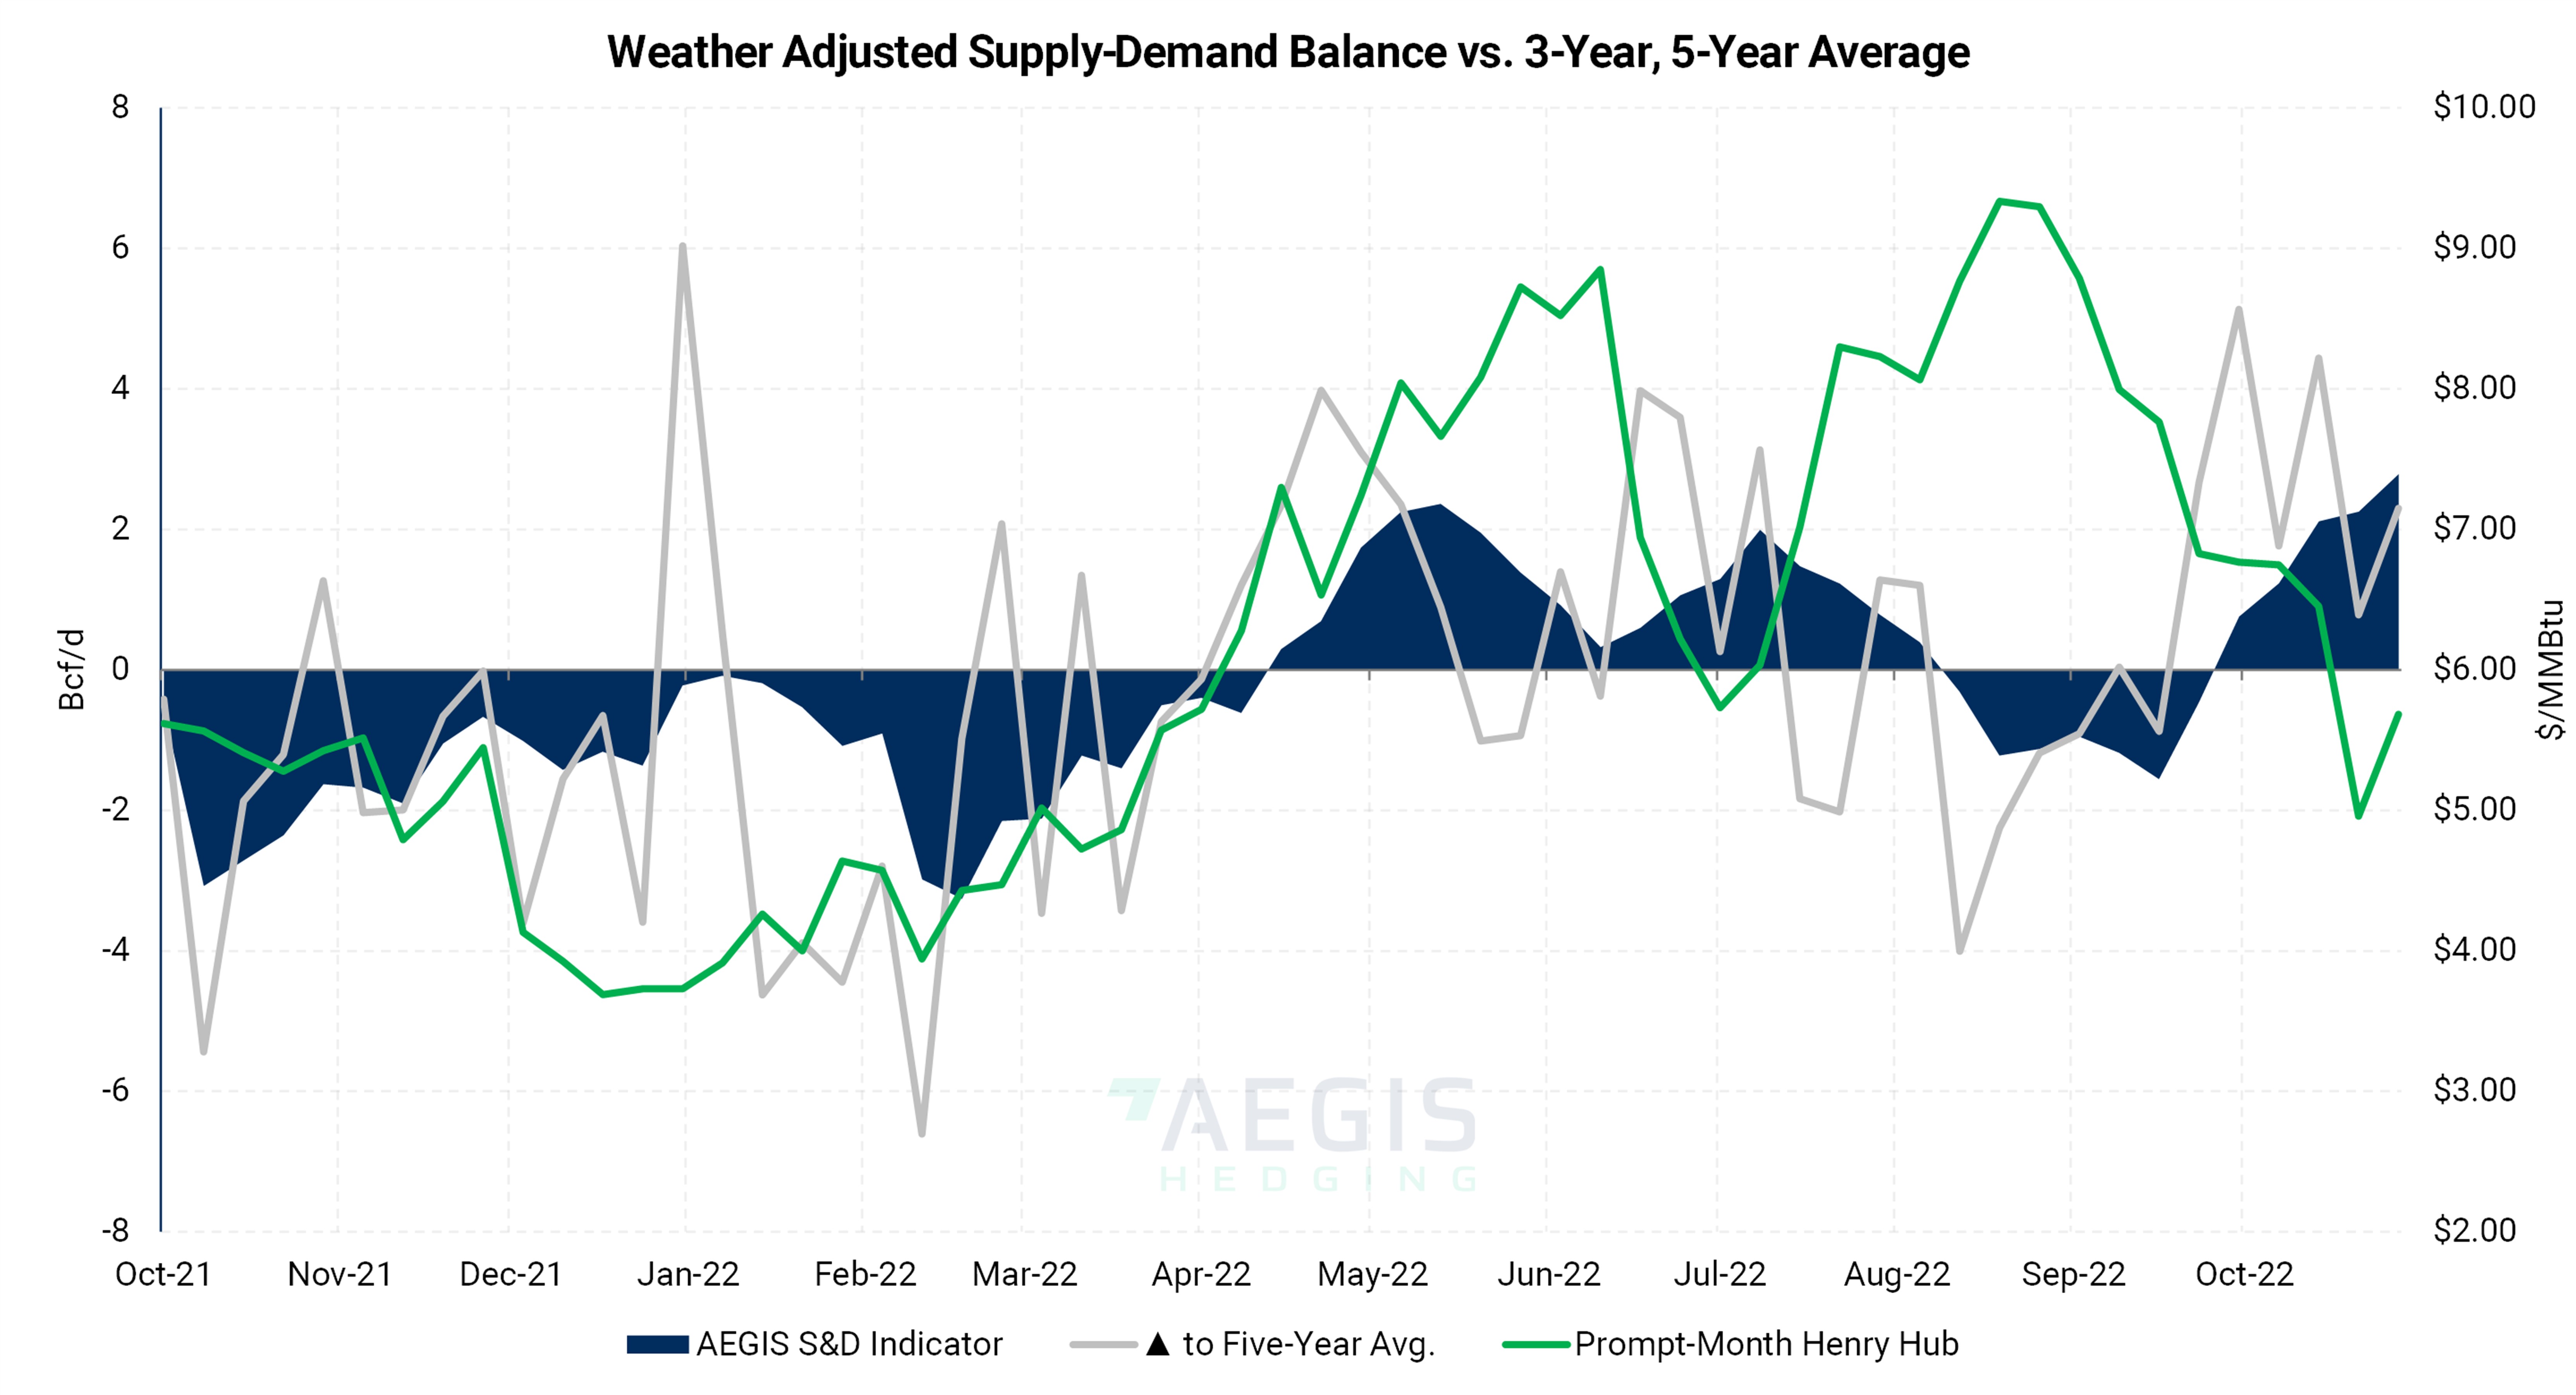
- The chart below shows three things:
- In grey, an AEGIS model for the relative tightness or looseness of the supply-demand balance if the effect of weather is removed. A positive number means more supply than demand as compared to the last five years.
- The blue area is a smoothed average of the grey line.
- Last, the green line shows prompt-month henry hub price to show how gas prices rise and fall based on the supply-demand balance
- Above the zero line indicates an oversupplied or loose market, while below the zero line indicates an undersupplied or tight market
- During the second half of 2021, the market was undersupplied. This year, the supply-demand balance has flipped between oversupply and undersupply to its current indication of 2 Bcf/d oversupplied.

Five weeks ago, it appeared inventories would begin this winter at a materially low level, not anymore
The rate of storage builds has brought the amount of gas in storage to a much more normal level
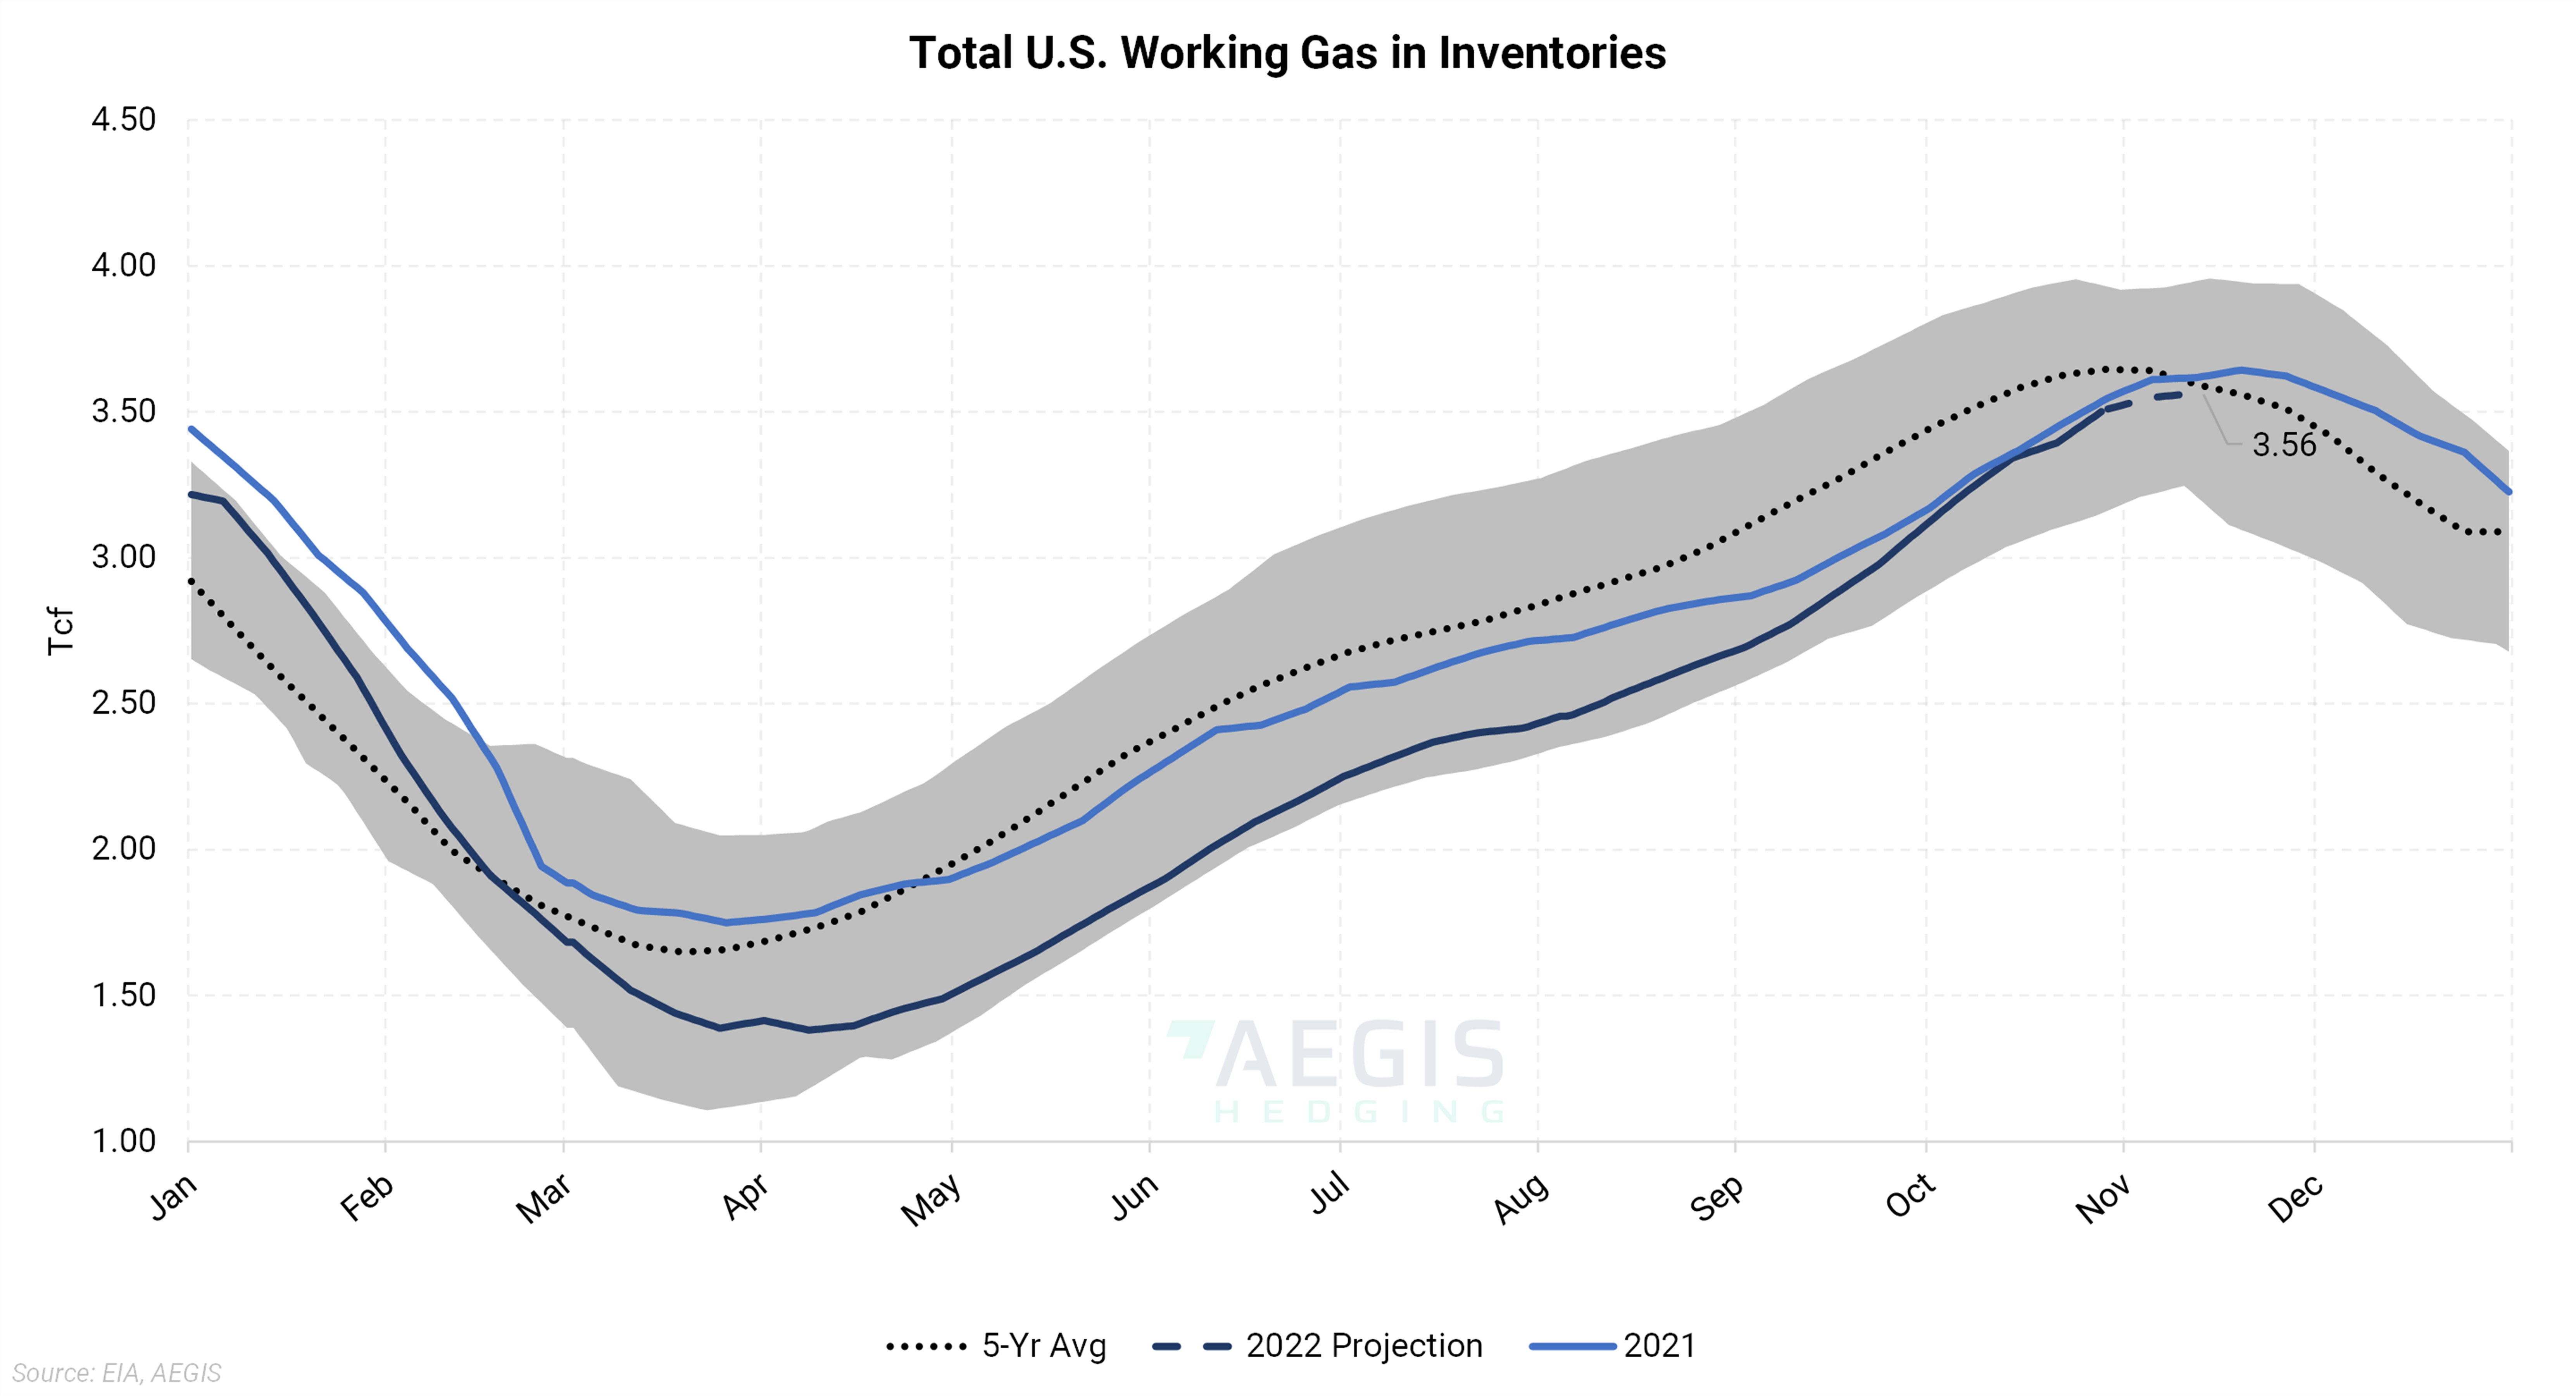
- The chart below shows the total amount of working gas in storage this year, last year, and the high and low of the previous five years. The dotted line is the five-year average. It is important because deviations from it usually result in a meaningful change in price.
- In June, Freeport LNG went offline, resulting in 2 Bcf/d of lost demand. Usually, this would have increased the amount of gas expected to be in storage by the end of the injection season. Still, due to record heat this summer, the power sector has used the additional supply from the LNG outage as the ERCOT grid has continuously set record highs.
- Freeport is expected to come back online in late November at a capacity of 2 Bcf/d. This event could further tighten the market. Because of the timing, it should not affect inventory levels going into winter, but it could expand the storage deficit during the withdrawal season.

Conclusion:
The storage deficit is shrinking. Is the risk of significantly higher prices gone?
While AEGIS models currently show a looser supply and demand balance, the deficit could expand further if weather begins to support demand or production stagnates. With inventories expected to start winter at a healthy level, prices have softened to reflect this reduction of risk premium. However, the deficit persists (although less pronounced than it was) and with Freeport LNG expected to restart soon, the risk that the deficit could expand and lead to higher prices remains.


