OPEC+ maintained its oil output policy at its meeting on Wednesday, pointing to declining inventories and a rise in oil prices as evidence that cuts have helped support the oil market. The group did urge caution on returning output too quickly, as coronavirus cases continue to increase. Still, the consensus was that while prices remain at favorable levels and demand is returning, the cartel will restore output incrementally as the market allows.

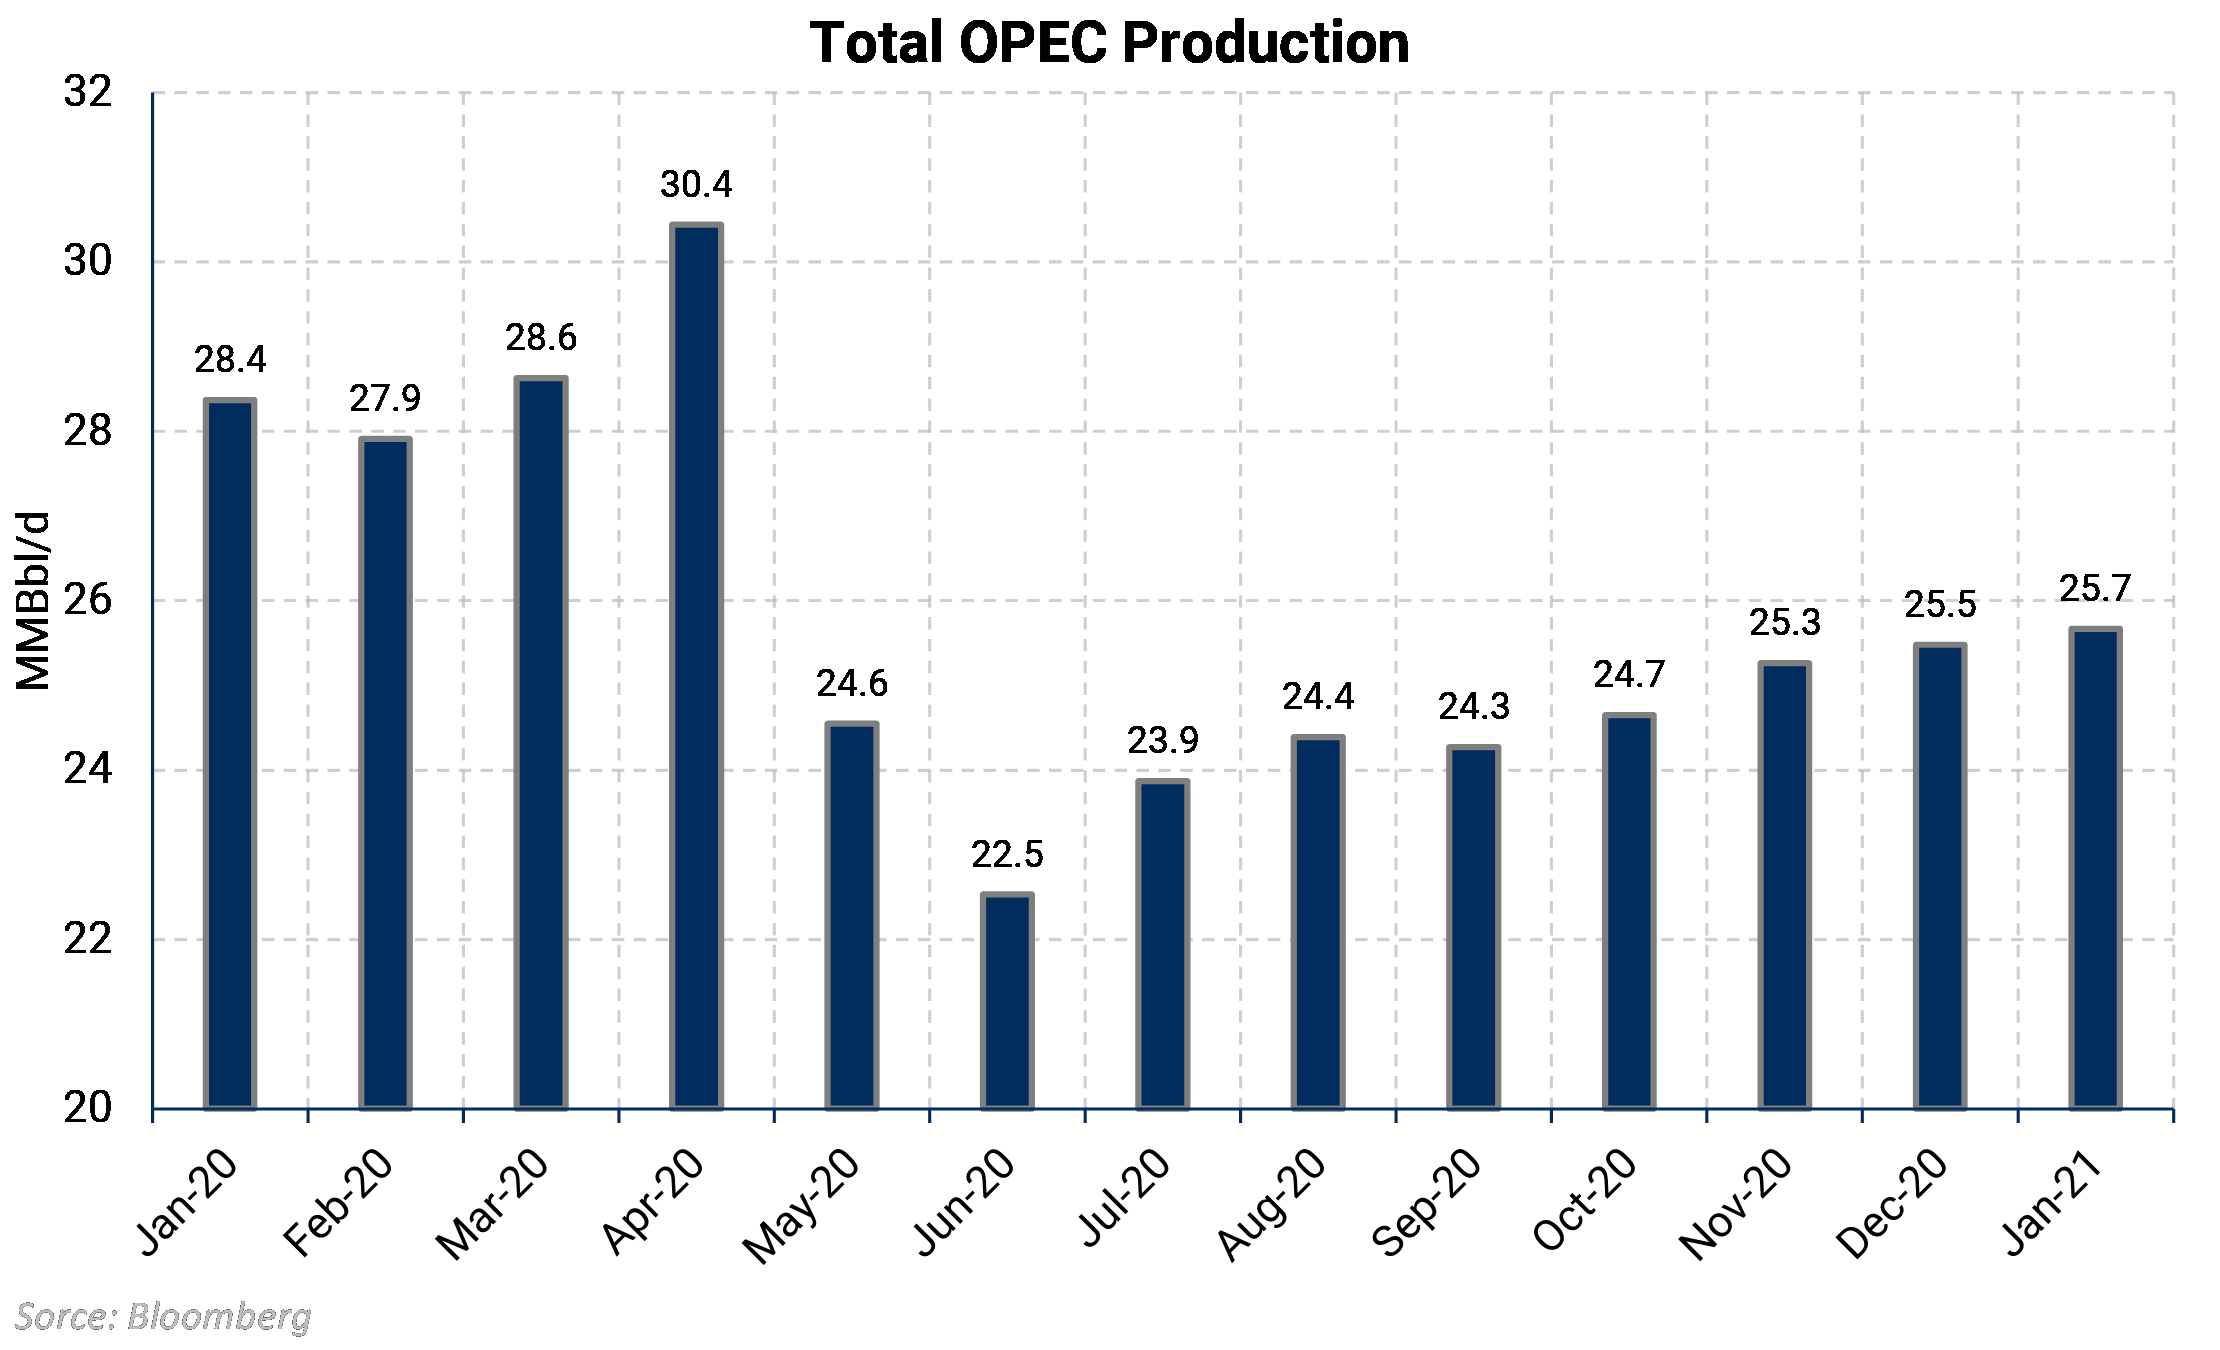
The chart shows OPEC production going back to January of last year. Last month, the group was expected to return 500 MBbl/d in output back to the market but only brought back 200 MBbl/d. This was due, in part, to the extra 1 MMBbl/d cut implemented by Saudi Arabia offsetting production hikes by member countries.
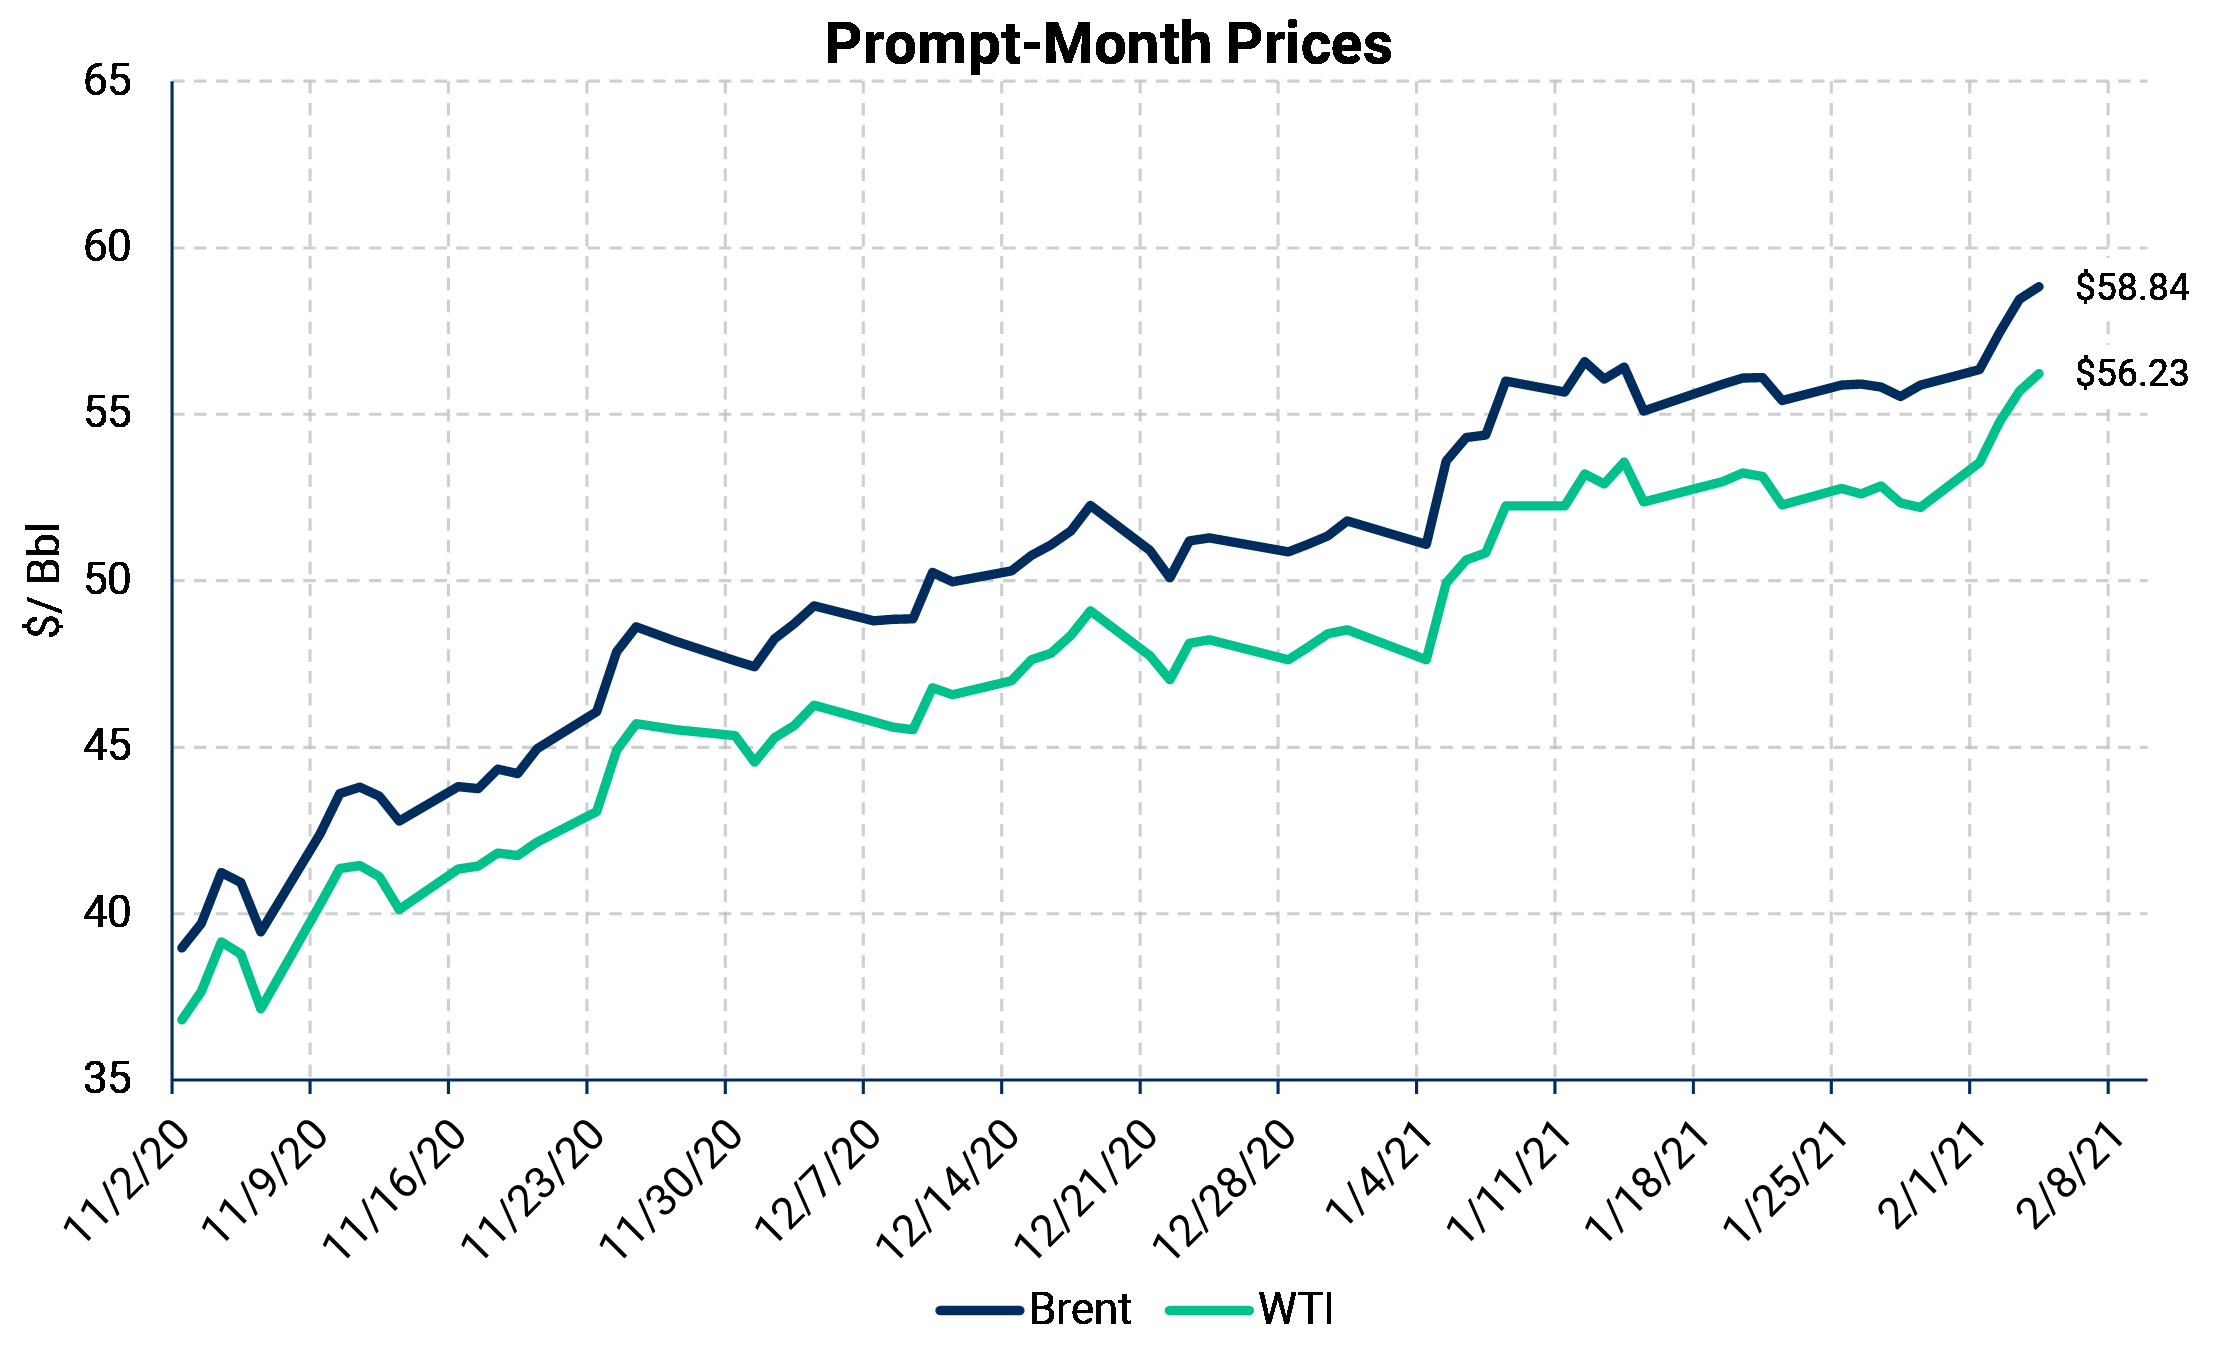
Oil has rallied from historic lows hit last year, thanks to the record OPEC+ output cuts that the group is starting to unwind. OPEC said, "While economic prospects and oil demand would remain uncertain in the coming months, the gradual rollout of vaccines around the world is a positive factor for the rest of the year, boosting the global economy and oil demand," in a statement following the committee meeting.

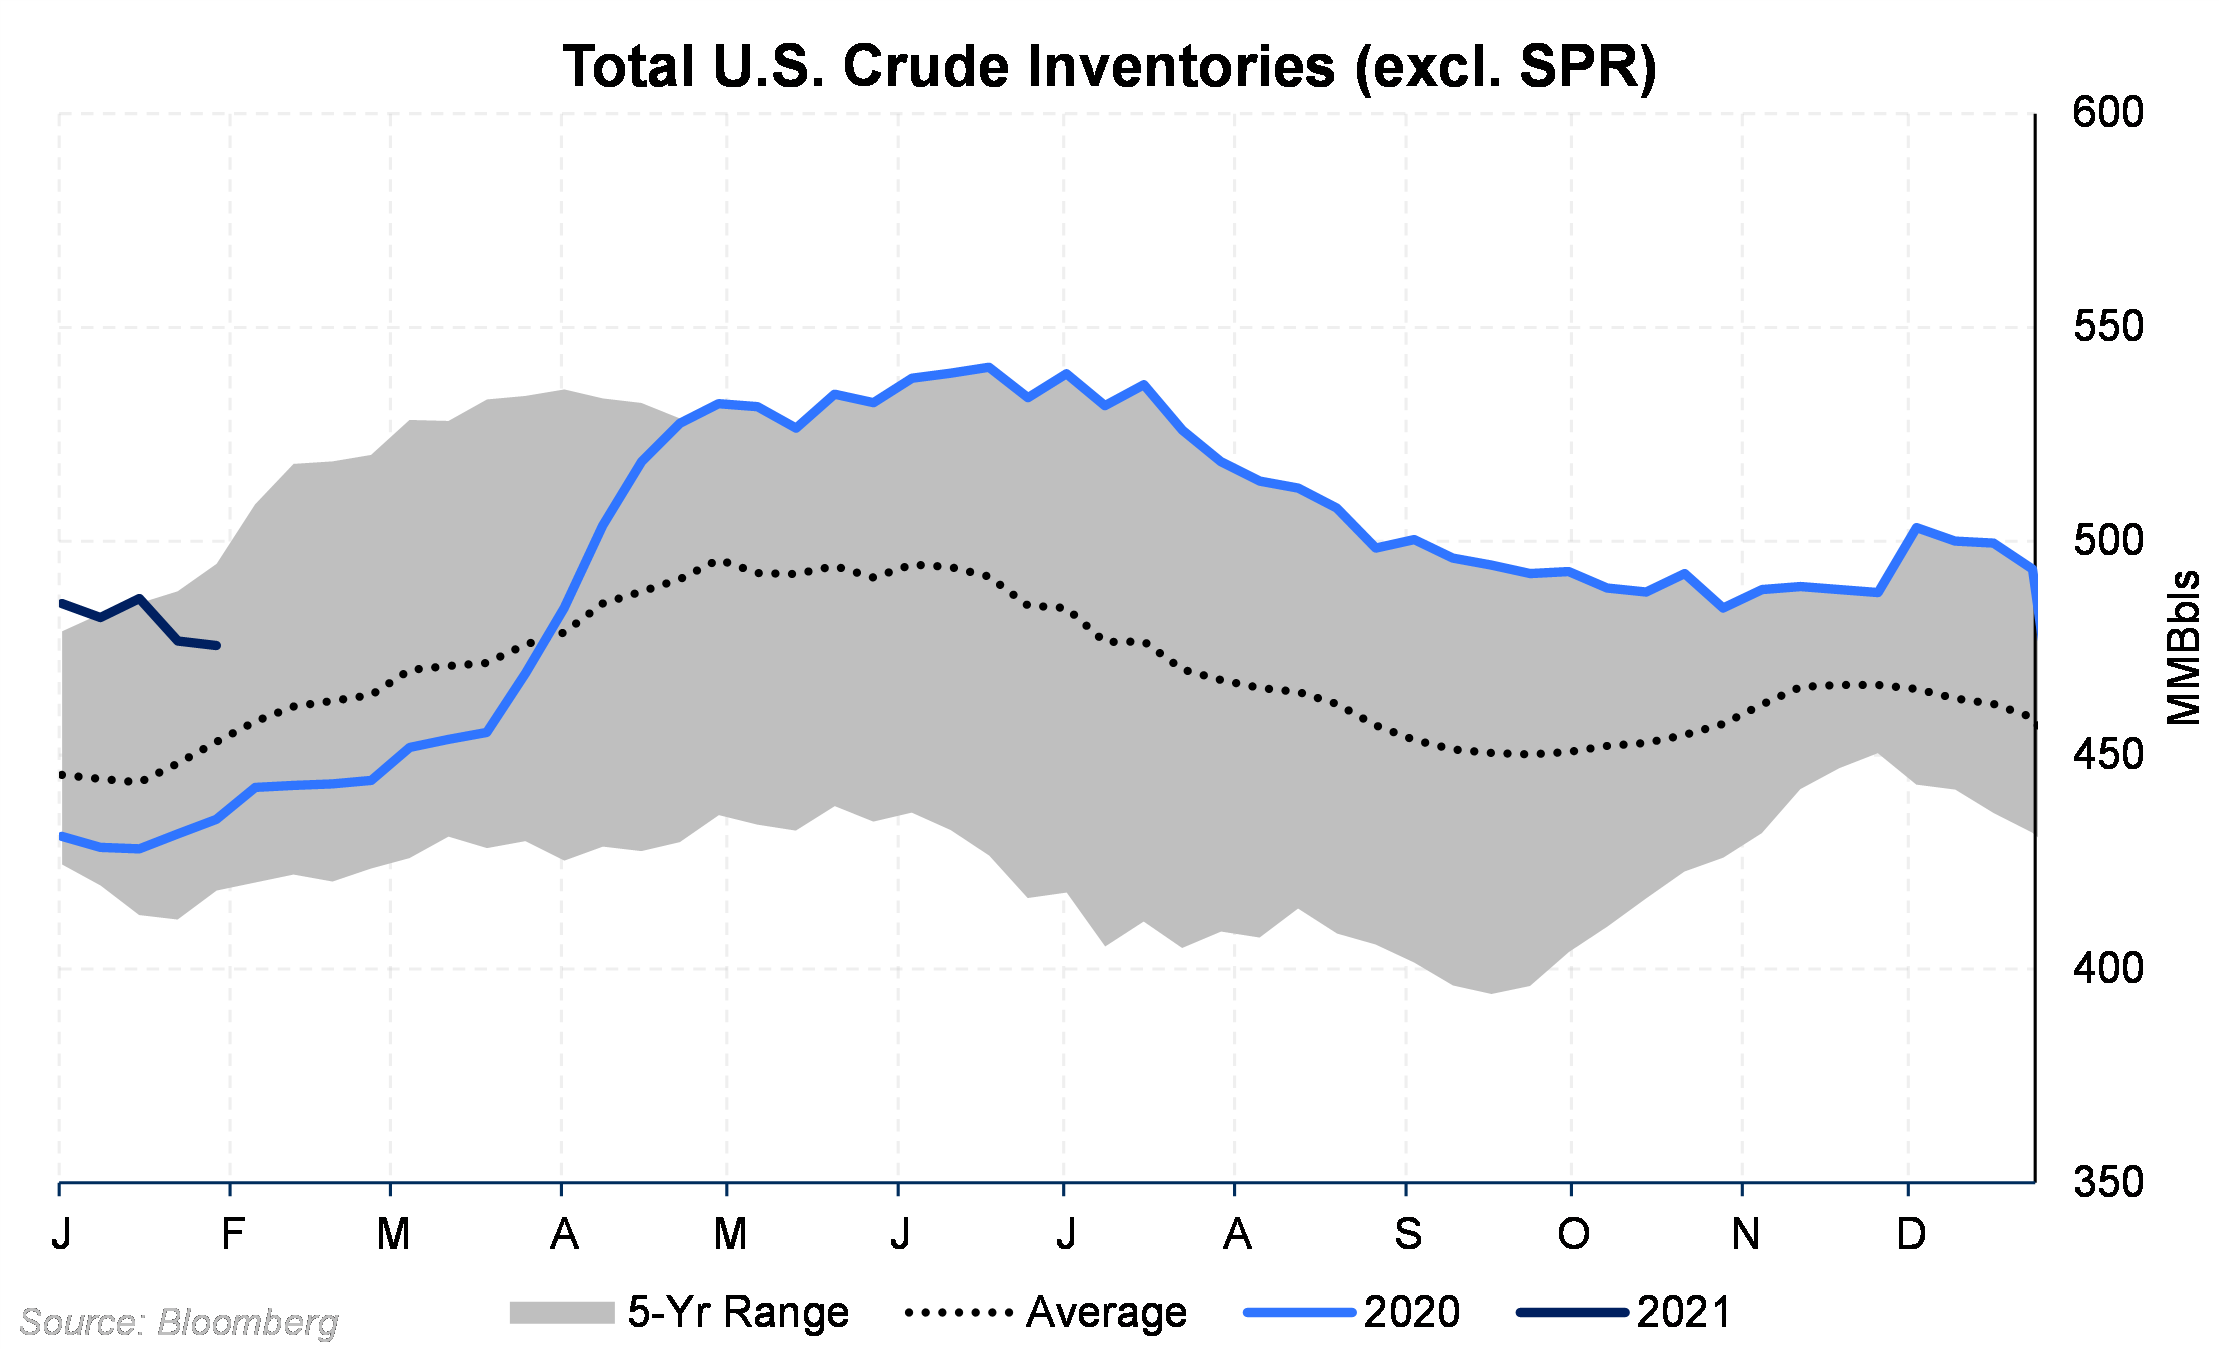
WTI has been in a strong upward trend particularly over the last week as data has shown in inventory levels are shrinking. In the United States, crude inventories have declined by 10.9 MMBbls over the past two weeks and 17.8 MMBbls in January to bring stocks closer to the five-year average. Since reaching a peak inventory level of 540 MMBbls last June, stocks have decreased by 65 MMBbls.

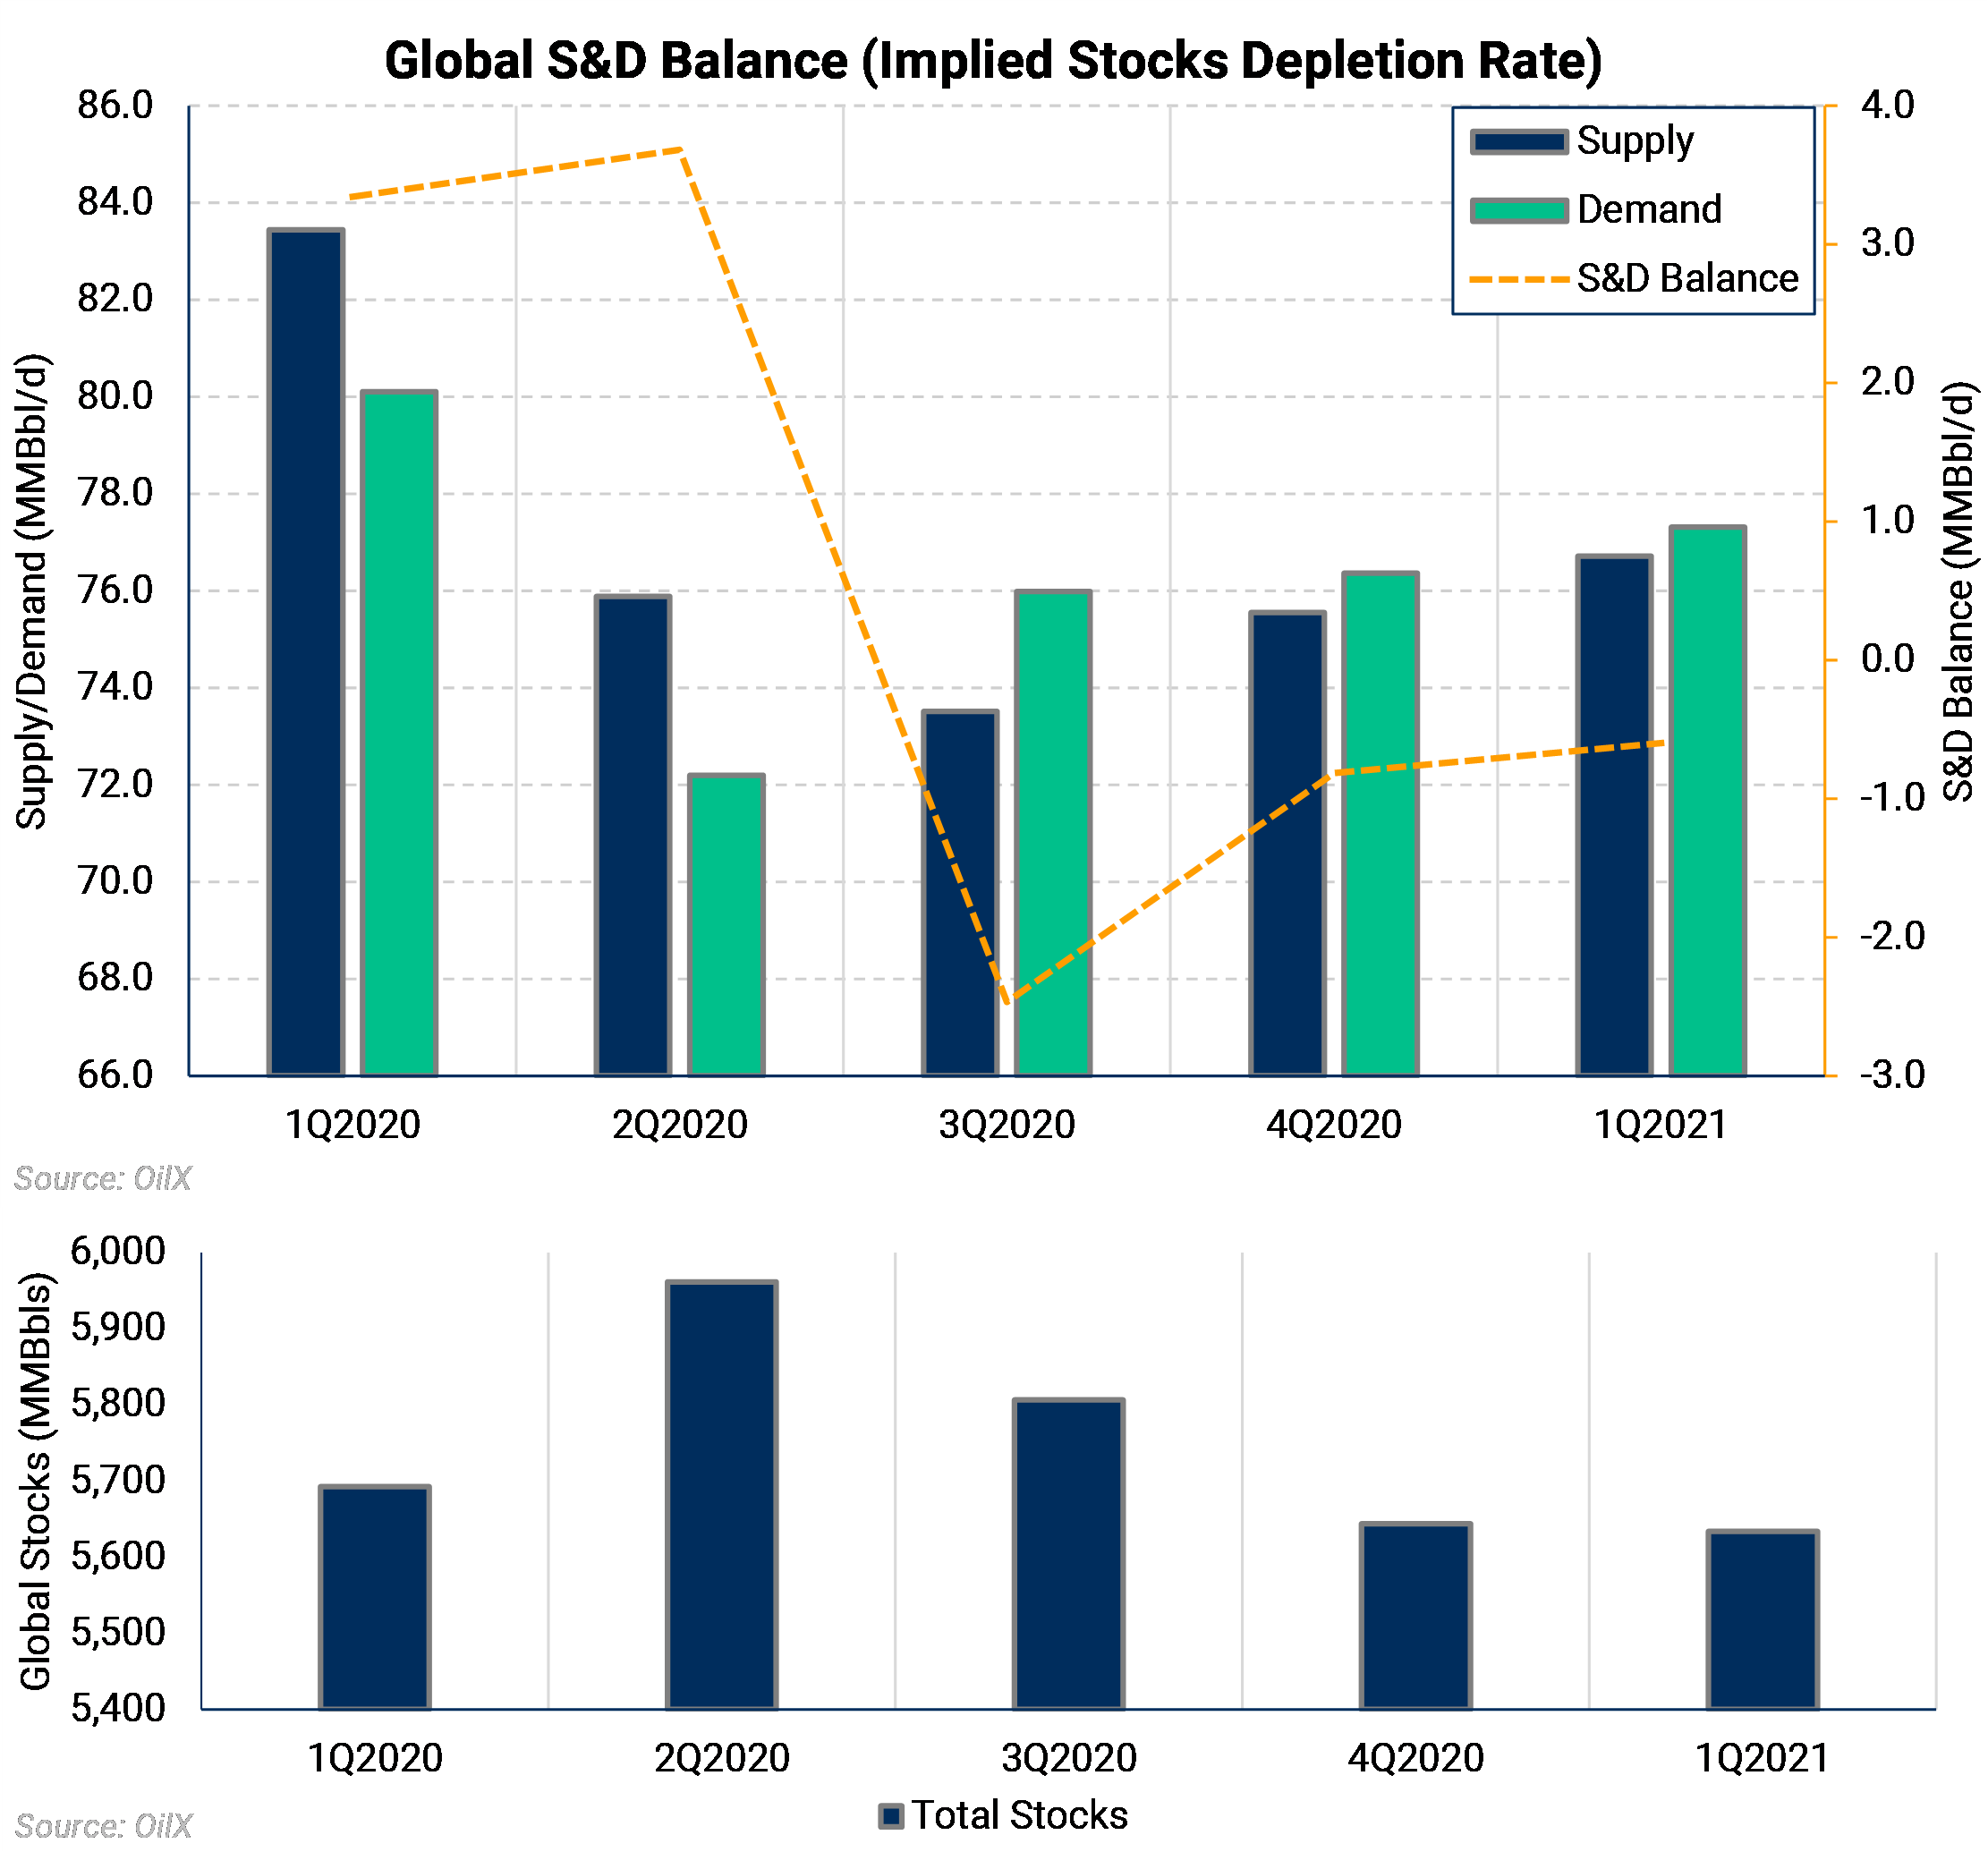
Global Inventories have also been declining at a rapid clip, thanks in part to OPEC's supply cuts. According to OilX, the global S&D balance shows stocks declined in January at their quickest seasonal rate in the last five years. Global stocks declined at a pace of (-) 530 MBbl/d, in contrast with its five-year January average of (+) 345 MBbl/d. While the global S&D balance is prone to seasonality, January's draw on storage is a bullish signal that has helped crude prices sustain its most recent rally.

The top chart shows the global Supply and Demand Balance and its implied stock depletion rate. The implied stock depletion rate is simply the difference between supply and demand. The chart shows that the market has been in a deficit (shown as negative numbers in the yellow dashed line), causing volumes to be drawn from storage since 3Q2020. The chart also shows demand and supply increasing after the coronavirus initially removed several million barrels of demand last year. The bottom chart shows the magnitude by which stocks have declined over the past eight months. Global inventories are near 5.63 billion barrels, a 330 MMBbl decrease from their high of 5.96 billion barrels in 2Q2020.