|
The proportion of natural gas burned in July for electricity has not followed conventional norms. As a percent of thermal load (coal+gas), natural gas burn has stayed elevated for the level of price so far this year, but especially over the last month. The chart below shows what percentage of thermal load gas typically represents for a given price. In previous years, gas utilization accounted for between 60-65% of thermal load when gas languished around $1.75/MMBtu or so. When gas prices trade higher, gas loses out in the power stack and is an example of higher prices fixing higher prices. The dotted black line shows the economic sliding scale for gas utilization versus coal. Natural gas prices this July have averaged seasonally much higher than in previous years. Some of this can be attributed to the higher propensity to burn gas versus coal. Most of this summer (light blue dots) has shown a regime change in what is considered a normal relationship between gas price and usage in the power stack. Price, as a gas burn limiting mechanism, has broken down.
|
||||
|
|
||||
|
|
||||
|
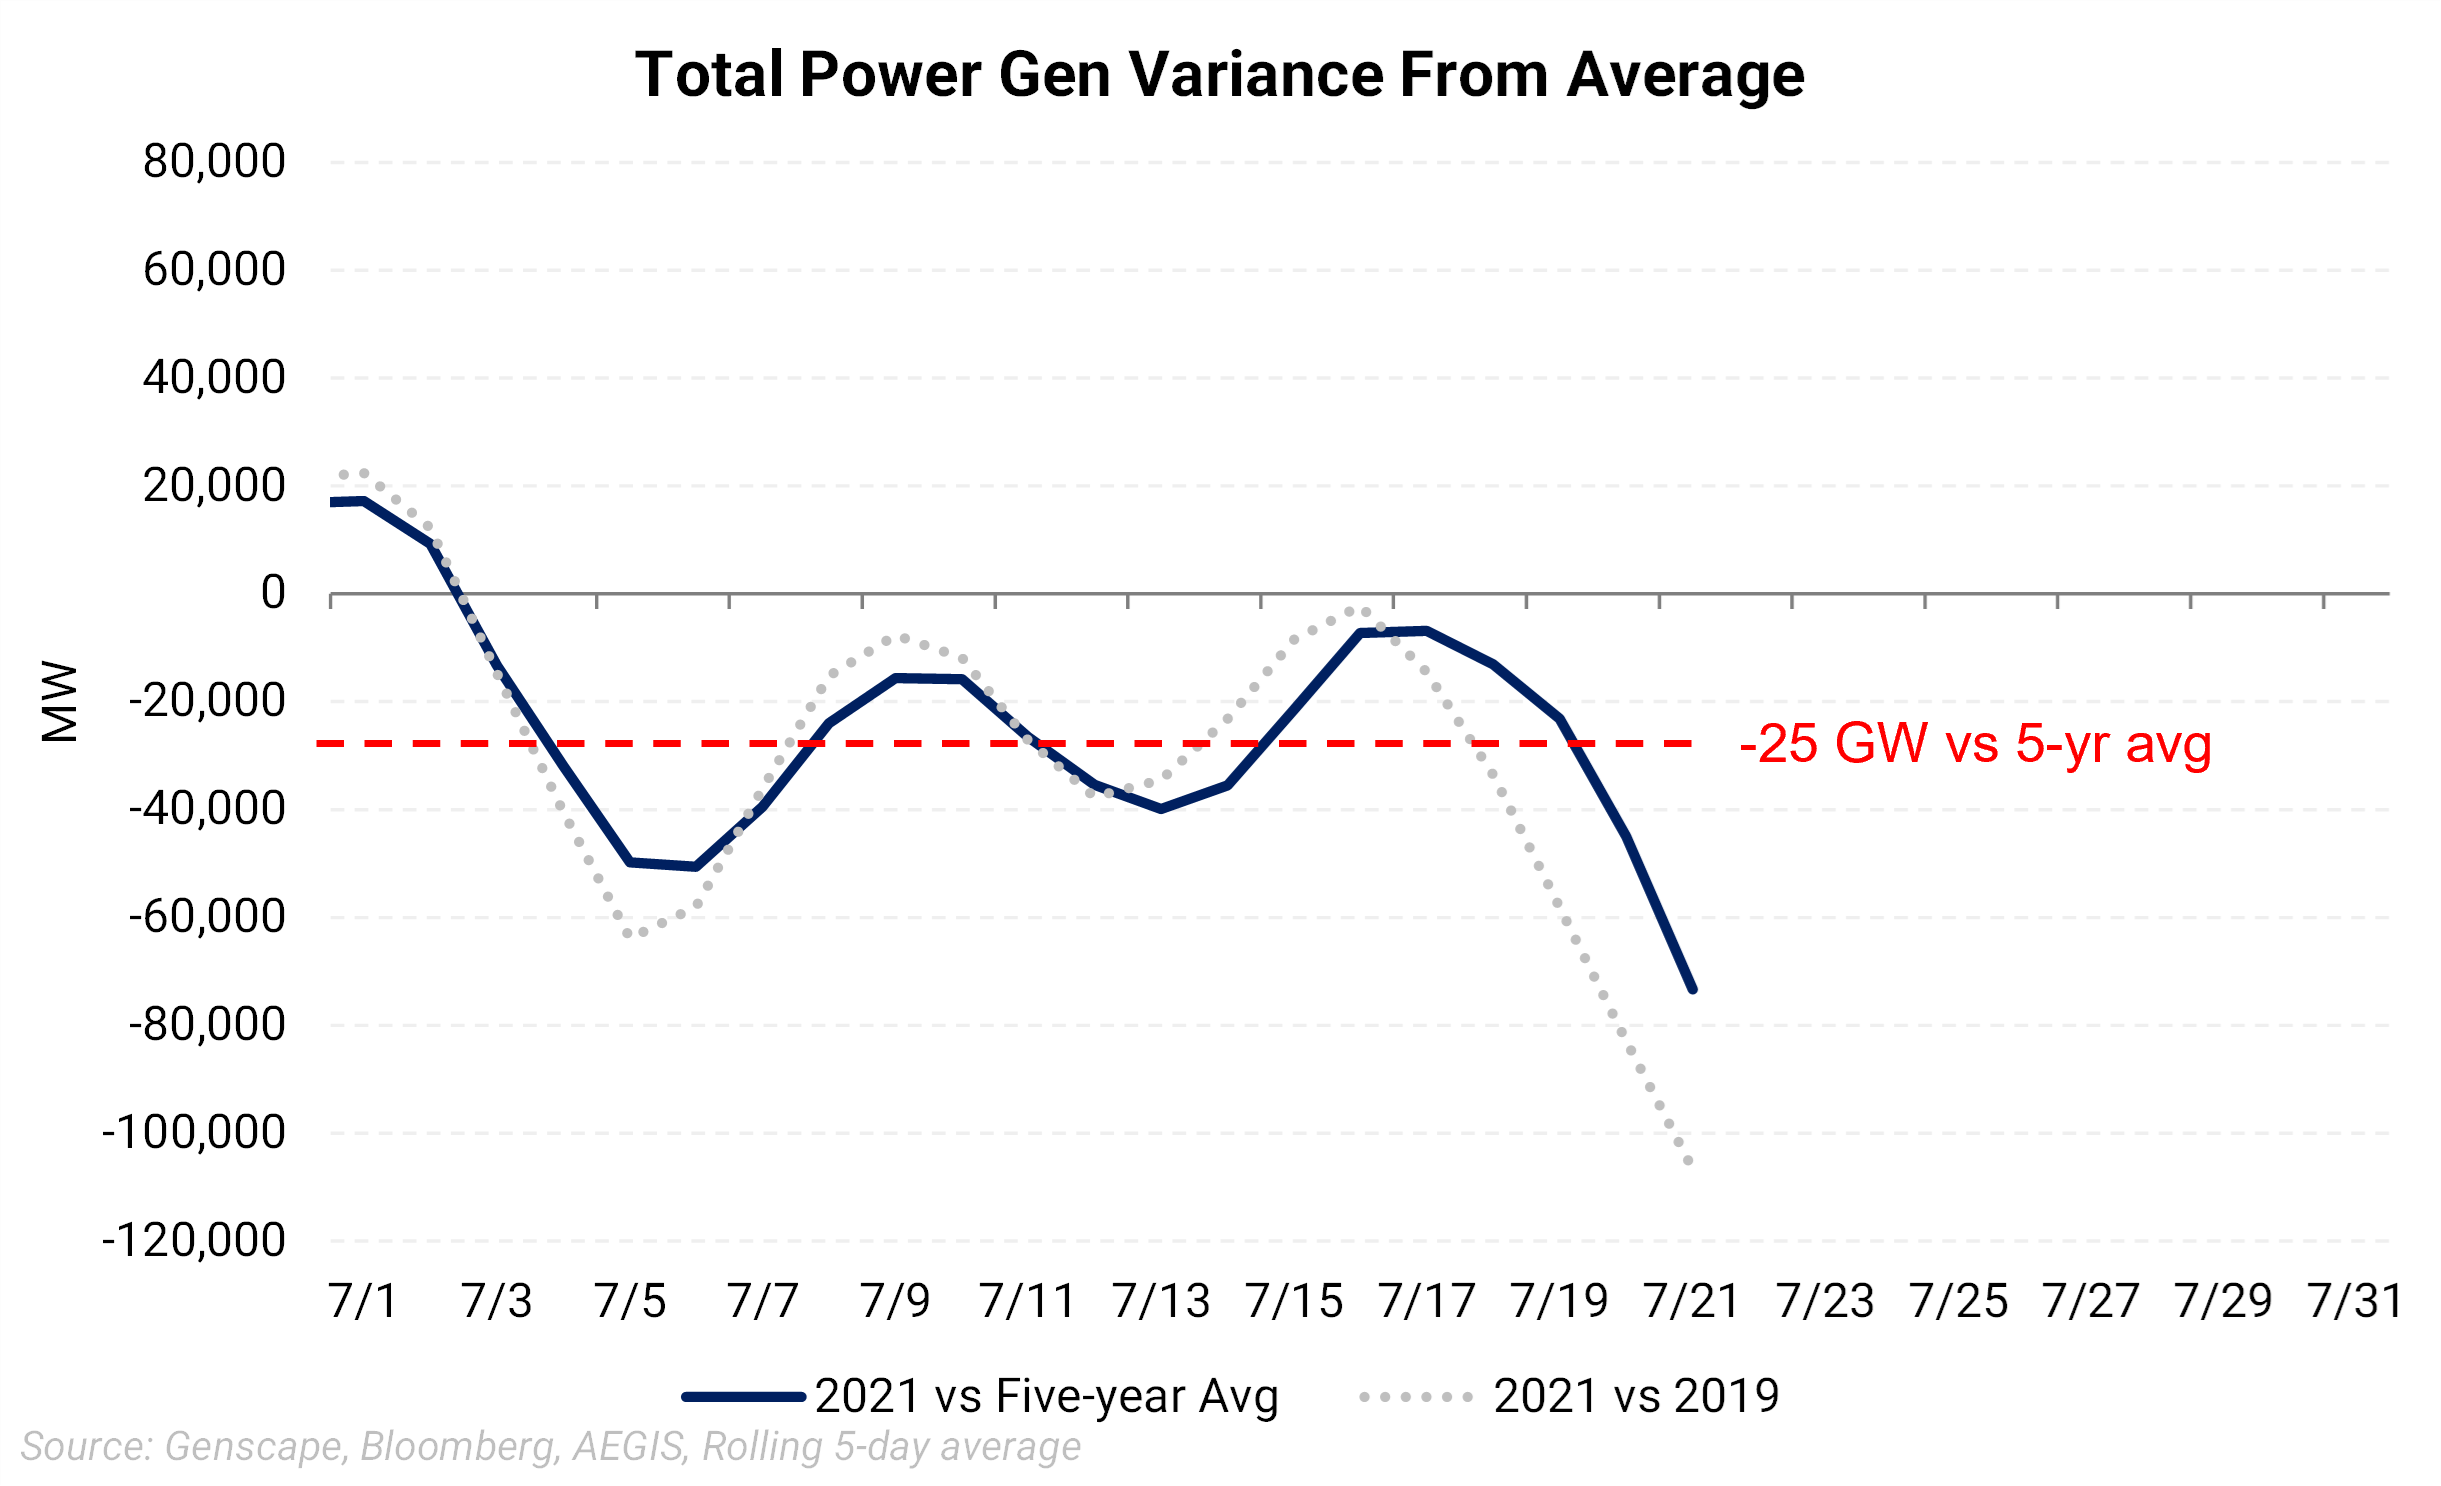
The amount of electricity produced from natural gas has been about 12 GW above the five-year average in the first 21 days of July. What makes this so interesting is that total electricity generation is down 25 GW this month versus the five-year average. Also, Henry Hub's cash prices have averaged $3.67/MMBtu. |
||||
|
| The chart above shows natural gas burn in July hovering a little over the five-year average. It is notable how much lower natural gas burn is in 2021 versus 2020, granted it was hotter in 2020 for July and natural gas averaged $1.75/MMBtu. | Natural gas used for power generation has so far in July accounted for 12 GW more than the five-year average. This comes despite the fact that total power generation is down compared to the five-year average for the same period. |
 |
 |
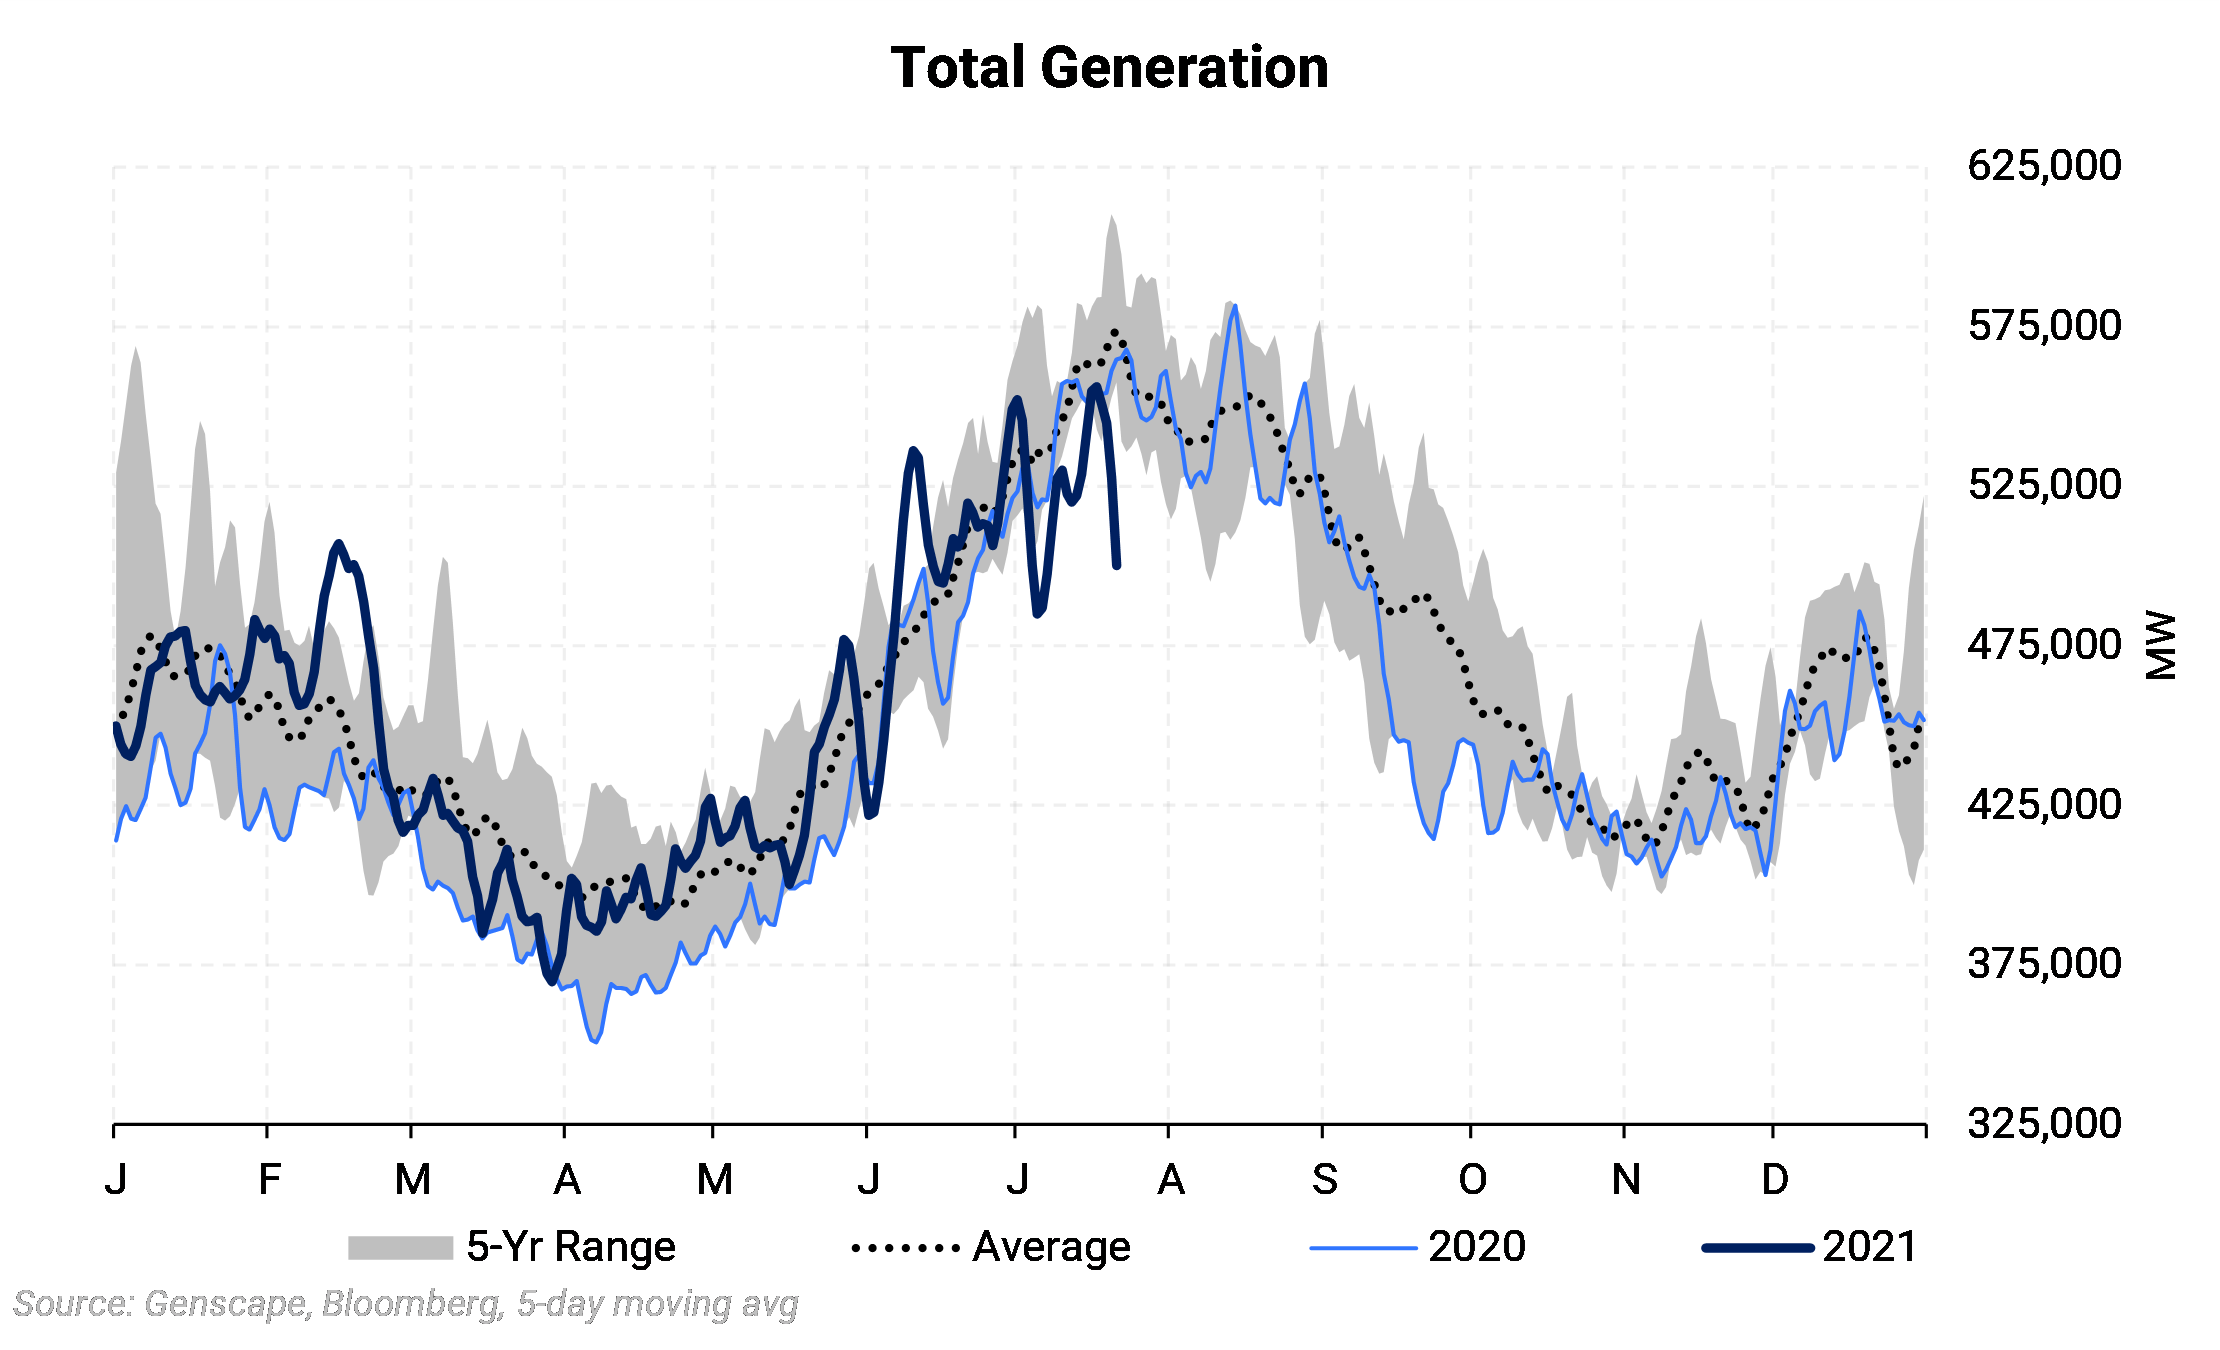
| Total electricity generation in July ‘21 has been much lower than in recent years. So far in July, electricity generation for power is the lowest in at least the past six years. | The July ‘21 electricity generation has been about -25 GW below the five-year average. In other words, the US has needed less electricity than in previous years, primarily due to weather. |
|
There has been a higher propensity to burn gas lately despite gas prices that would usually cause gas to lose out to coal-fired generation. There has been coal-to-gas switching, no doubt, but likely not to the extent we would have seen in the past. The underperformance in the non-thermal part of the power stack has also been a boon for natural gas. Hydropower, essential to the western US, has been down 28%, or 9 GW in July, due to a poor snowpack last winter and an ongoing drought. In addition, the West has been where much of the extreme heat has materialized in the Lower 48, causing power producers to lean more on gas and import power from outside their region. |
|
Commodity Interest Trading involves risk and, therefore, is not appropriate for all persons; failure to manage commercial risk by engaging in some form of hedging also involves risk. Past performance is not necessarily indicative of future results. There is no guarantee that hedge program objectives will be achieved. Certain information contained in this research may constitute forward-looking terminology, such as "edge," "advantage," 'opportunity," "believe," or other variations thereon or comparable terminology. Such statements and opinions are not guarantees of future performance or activities. Neither this trading advisor nor any of its trading principals offer a trading program to clients, nor do they propose guiding or directing a commodity interest account for any client based on any such trading program. |