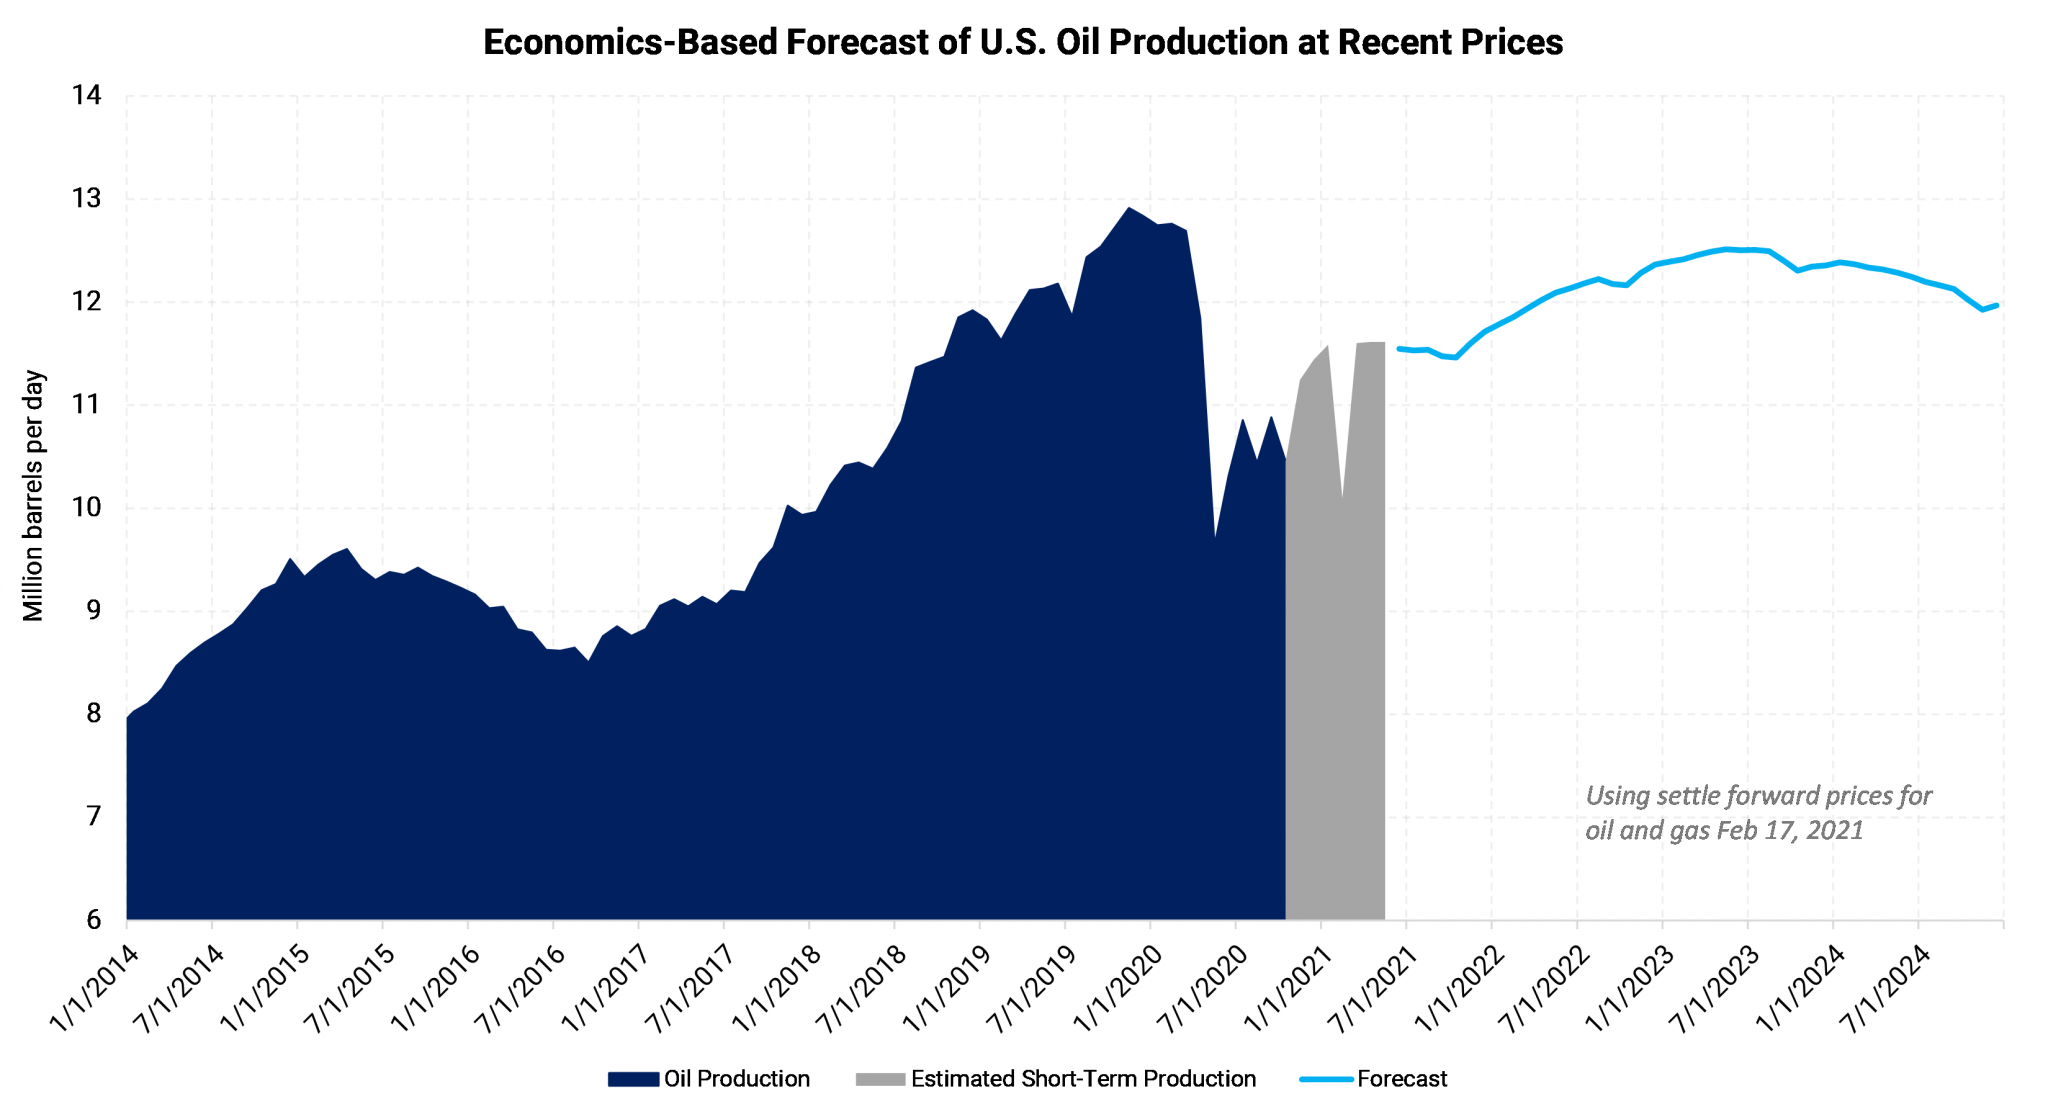
A six-dollar rise in 2022 and eight-dollar rise in 4Q2021 WTI prices suggest production could surge by near 1 MMBbl/d by 2023. That is, if operators' response to drilling economics has not changed.
In the last year, new drilling has decreased, and the existing (PDP) production is now declining at a much lower rate than it was in early 2020. Therefore, production growth could easily return if (1) E&Ps are given the proper economic signal, and (2) are able to respond. OPEC+'s upcoming decisions may be influenced by their conclusions on this subject.

We will address some of the assumptions shortly, but let's consider the short-term effects of such news, if true.
OPEC is likely wary of this outcome
OPEC+ meets in early March. Already, Saudi Arabia has reversed some short-term production cuts, as it presumably concludes that the market is recovering and demand is exceeding supply. Read more here.
If OPEC+ believes that the U.S. is on the cusp of new production expansion, the cartel (and cooperating nations) may conclude that prices have moved too high.
Will producers respond?
So far in this oil-price rally, AEGIS trading volume has been very heavy, with many producers rushing to execute. This increased interest may be the result of increased production forecasts for next year, but it appears to be catch-up hedges or opportunistic hedges to raise the weighted-average price received per barrel. In short, we do not see widespread interest in increasing production.
Past economics are not an indicator of future activity?
In the forecast model above, there are many assumptions regarding drilling activity. First, new wells are expected to have the same initial-production and decline rates as past wells. For example, a 10,000-foot lateral well in the Midland basin would perform similarly to nearby, existing wells.
Therefore, a new well turned to sales in a $55 price environment should generate similar cash flows to a well drilled in the last few years at a $55 price. The model, referenced in the chart above, assumes producers would be exactly as prone to drill an identical well now as they were in the recent past. This may not be true.
Consider two reasons why capital investment may be slower now versus in recent years. First, many public E&Ps — and we observe private companies are discussing the same — have publicly disclosed they intend to use "free cash" to pay back capital providers, usually to equity. This could include paying down debt, which creates higher residual value for the equity owners. Or, it could be a dividend (direct distribution to equity) or stock buybacks (reduces dilution of equity owners). Therefore, less cash may be available for growth capital than had been in the past, at a similar oil-price point.
Second, capital providers themselves may be reserved in encouraging new-well development. Some evidence: Diminished public-equity prices imply a higher cost of capital; There have been many examples of private-equity companies being combined to consolidate costs and drilling programs; Anecdotally, AEGIS has seen many examples of bids for producing assets that assume zero or low value for future drilling.
OPEC+'s wariness may make it moot
Our concern for prices is this: OPEC+ may soon decide that the risk is too high to allow supply to lag behind demand. If they let it go too far, the U.S. machine may start humming again.
Also, OPEC+ members and participants are likely hungry to start producing more into higher prices and improving demand fundamentals.
* - Note that the 11.5 MMBbl/d disagrees with weekly EIA estimates of around 11 MMBbl/d. The chart is derived from state data reliable only after several months, and recent months are modeled. The official EIA figures are survey-based and include an error term. State data also includes all petroleum liquids at the lease, while EIA figures remove some NGLs and other items.Questions or comments? Please contact us at research@aegis-energy.com.