Gas prices are heavily influenced by weather during the winter months (Nov-Mar), which so far have been warmer than climate normal. Natural gas futures have fallen since late October for a few other reasons than weather, but weather-driven residential and commercial demand loss has the most effect in winter.
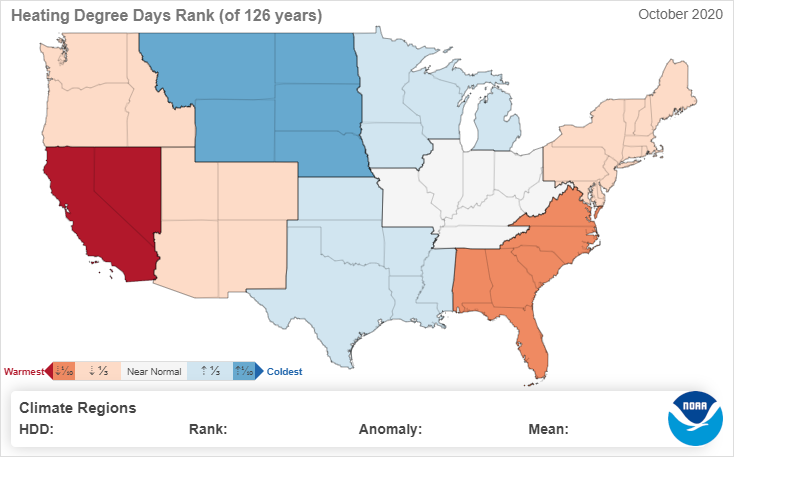
The heating degree day (HDD) map below shows how good October was for the gas market. The image shows historical HDD rankings by NOAA region. For example, if a region is red, it was very warm and could produce cooling demand. If a region is blue, it ranks high in heating demand.
You almost couldn't ask for a better October map for gas prices if you are a producer. Parts of the Midwest were cooler than normal and used gas for heat, but places in the Southeast were hotter than normal and recorded above-average October cooling demand. The combination of bullish weather, lower production, and strong LNG demand contributed to 2020 highs in gas prices across much of the curve through October 30.
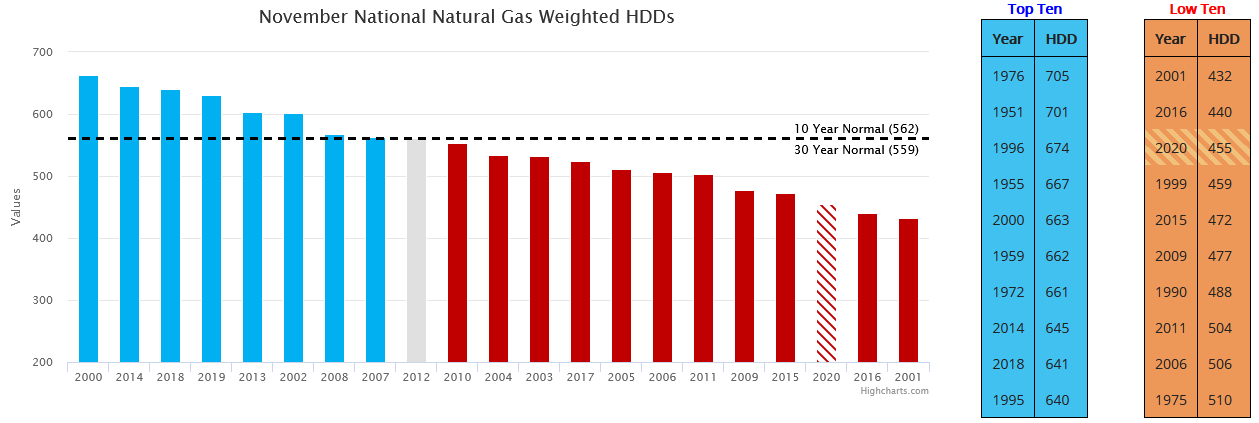
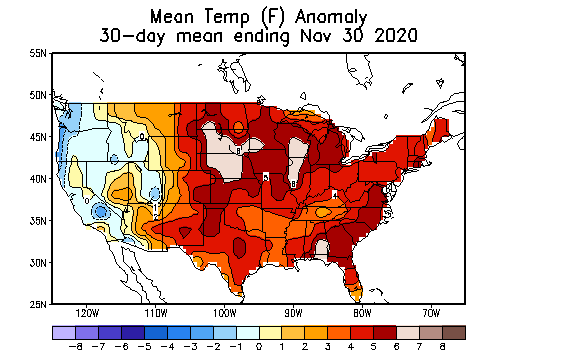
However, November was as bad as it gets. Weather was pitiful for the gas bulls as the first month of the winter gas strip was the third warmest in the past 20 years. The gas-weighted HDD chart below and to the left shows November HDDs at 455, which is 107 HDDs (~160 Bcf) lower than the 10-year climate normal, according to Commodity Weather Group (CWG). Also below is the weather deviation from the average mean temperature in Fahrenheit for November. A blowtorch could be a way to describe this map.
 |
 |
Now we know that we can blame some of the weak gas pricing on November weather, but how does December look? Hint: it's not a great start.
The map on the right (below) shows outright temperature history and forecast for December 1 through December 18. The image on the left (below) represents the deviation from climate normals during the same time period.
These forecasts suggest gas demand could be weak again in December. The chart at the very bottom by CWG shows the December forecast would put the month on par with the 10-year climate average at around 816 HDDs. It's not good or bad if December were to play out that way, but it is still early in the month and the forecast will change - for better or worse.
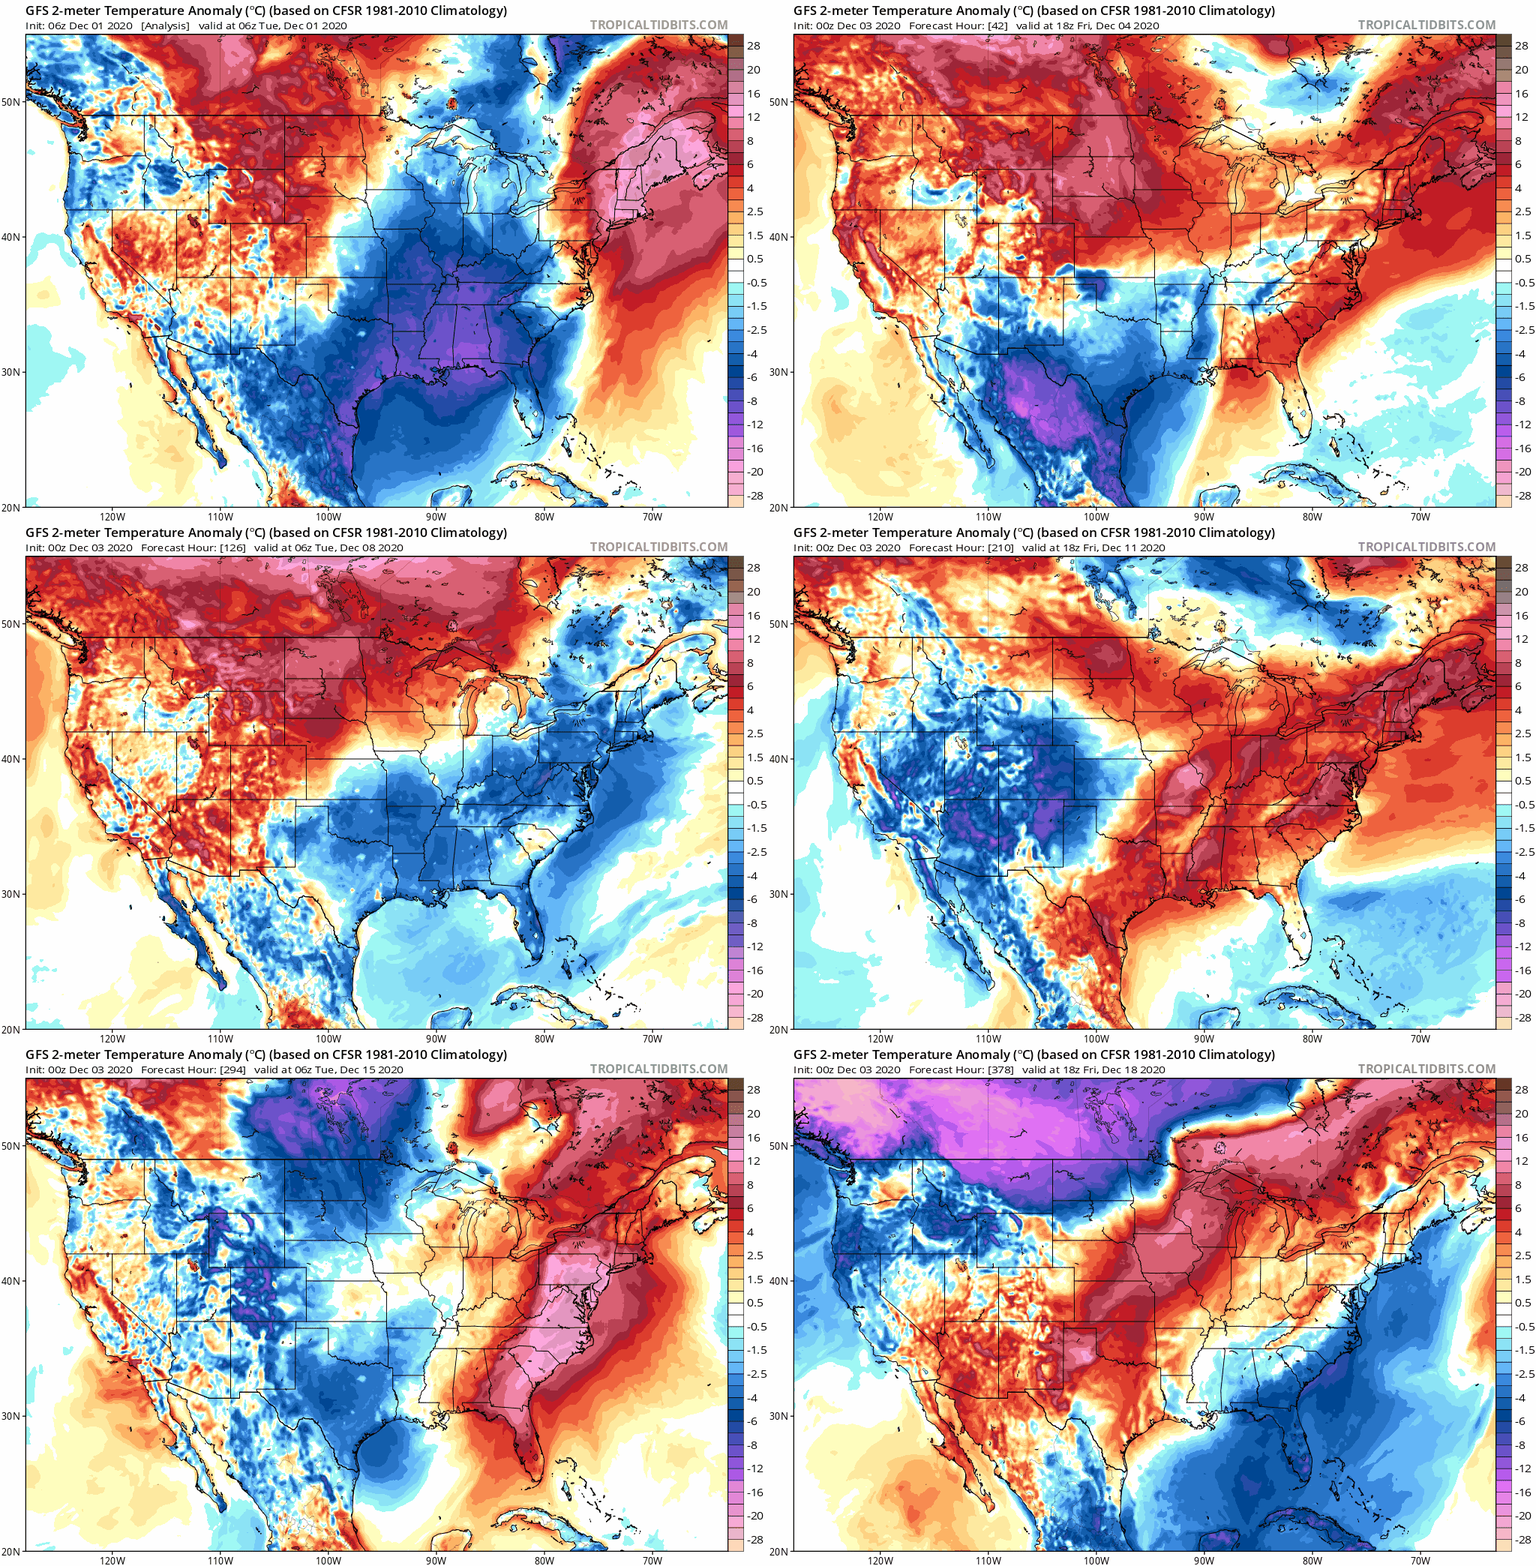 |
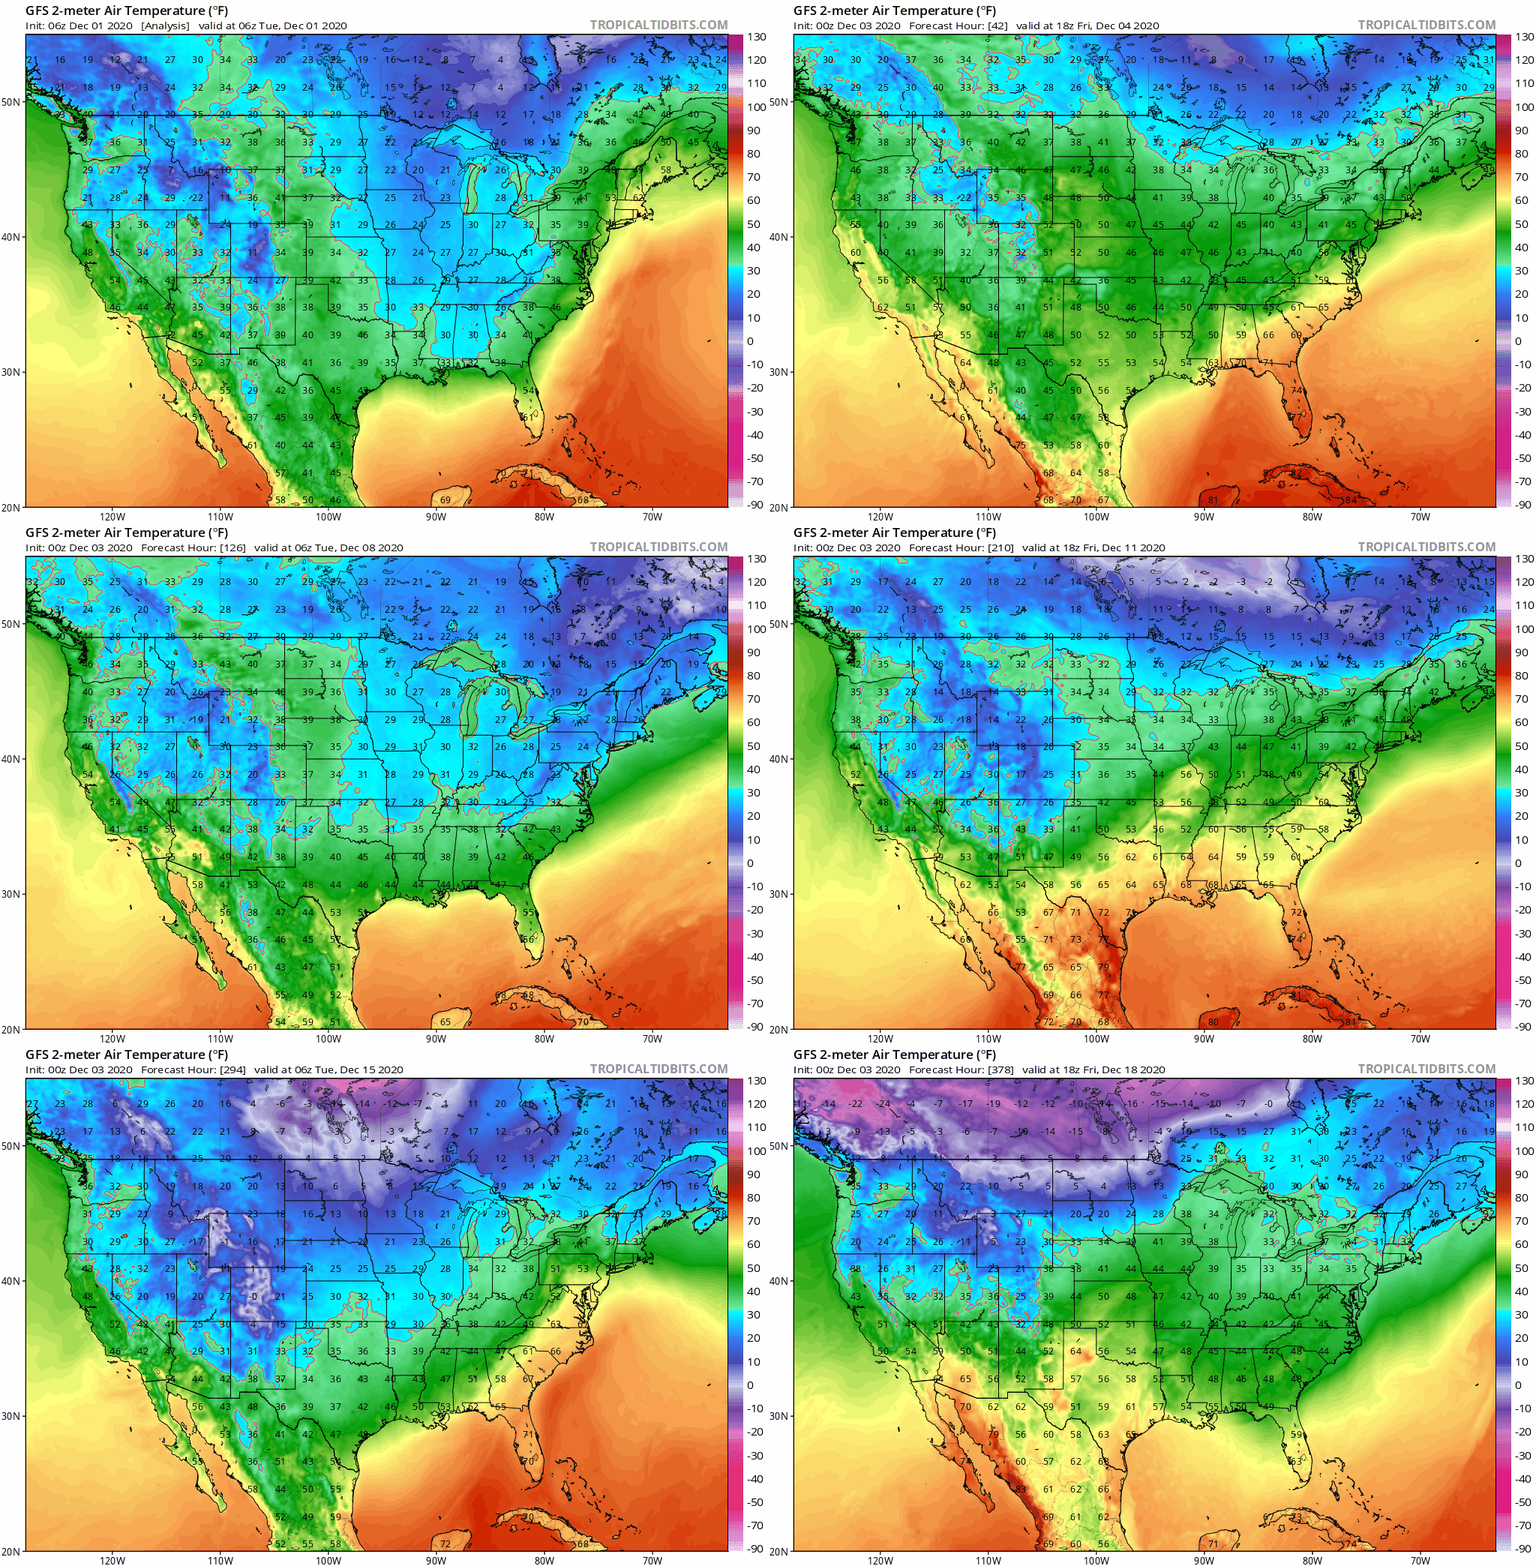 Source: Tropicalidbits.com Notes: Both animated maps are from the GFS 00z Dec 03 model run Source: Tropicalidbits.com Notes: Both animated maps are from the GFS 00z Dec 03 model run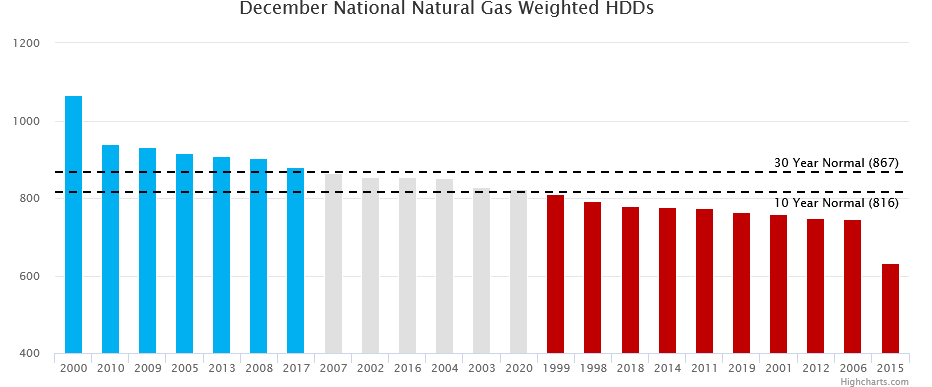 In summary, the weather was good for gas in October, bad in November, and looks to be mediocre in December. Other underlying variables in the gas markets are rather constructive, but that won't matter as much for the rest of the winter strip if weather continues to "underperform." In summary, the weather was good for gas in October, bad in November, and looks to be mediocre in December. Other underlying variables in the gas markets are rather constructive, but that won't matter as much for the rest of the winter strip if weather continues to "underperform." |