Chart as of 10/7/2023
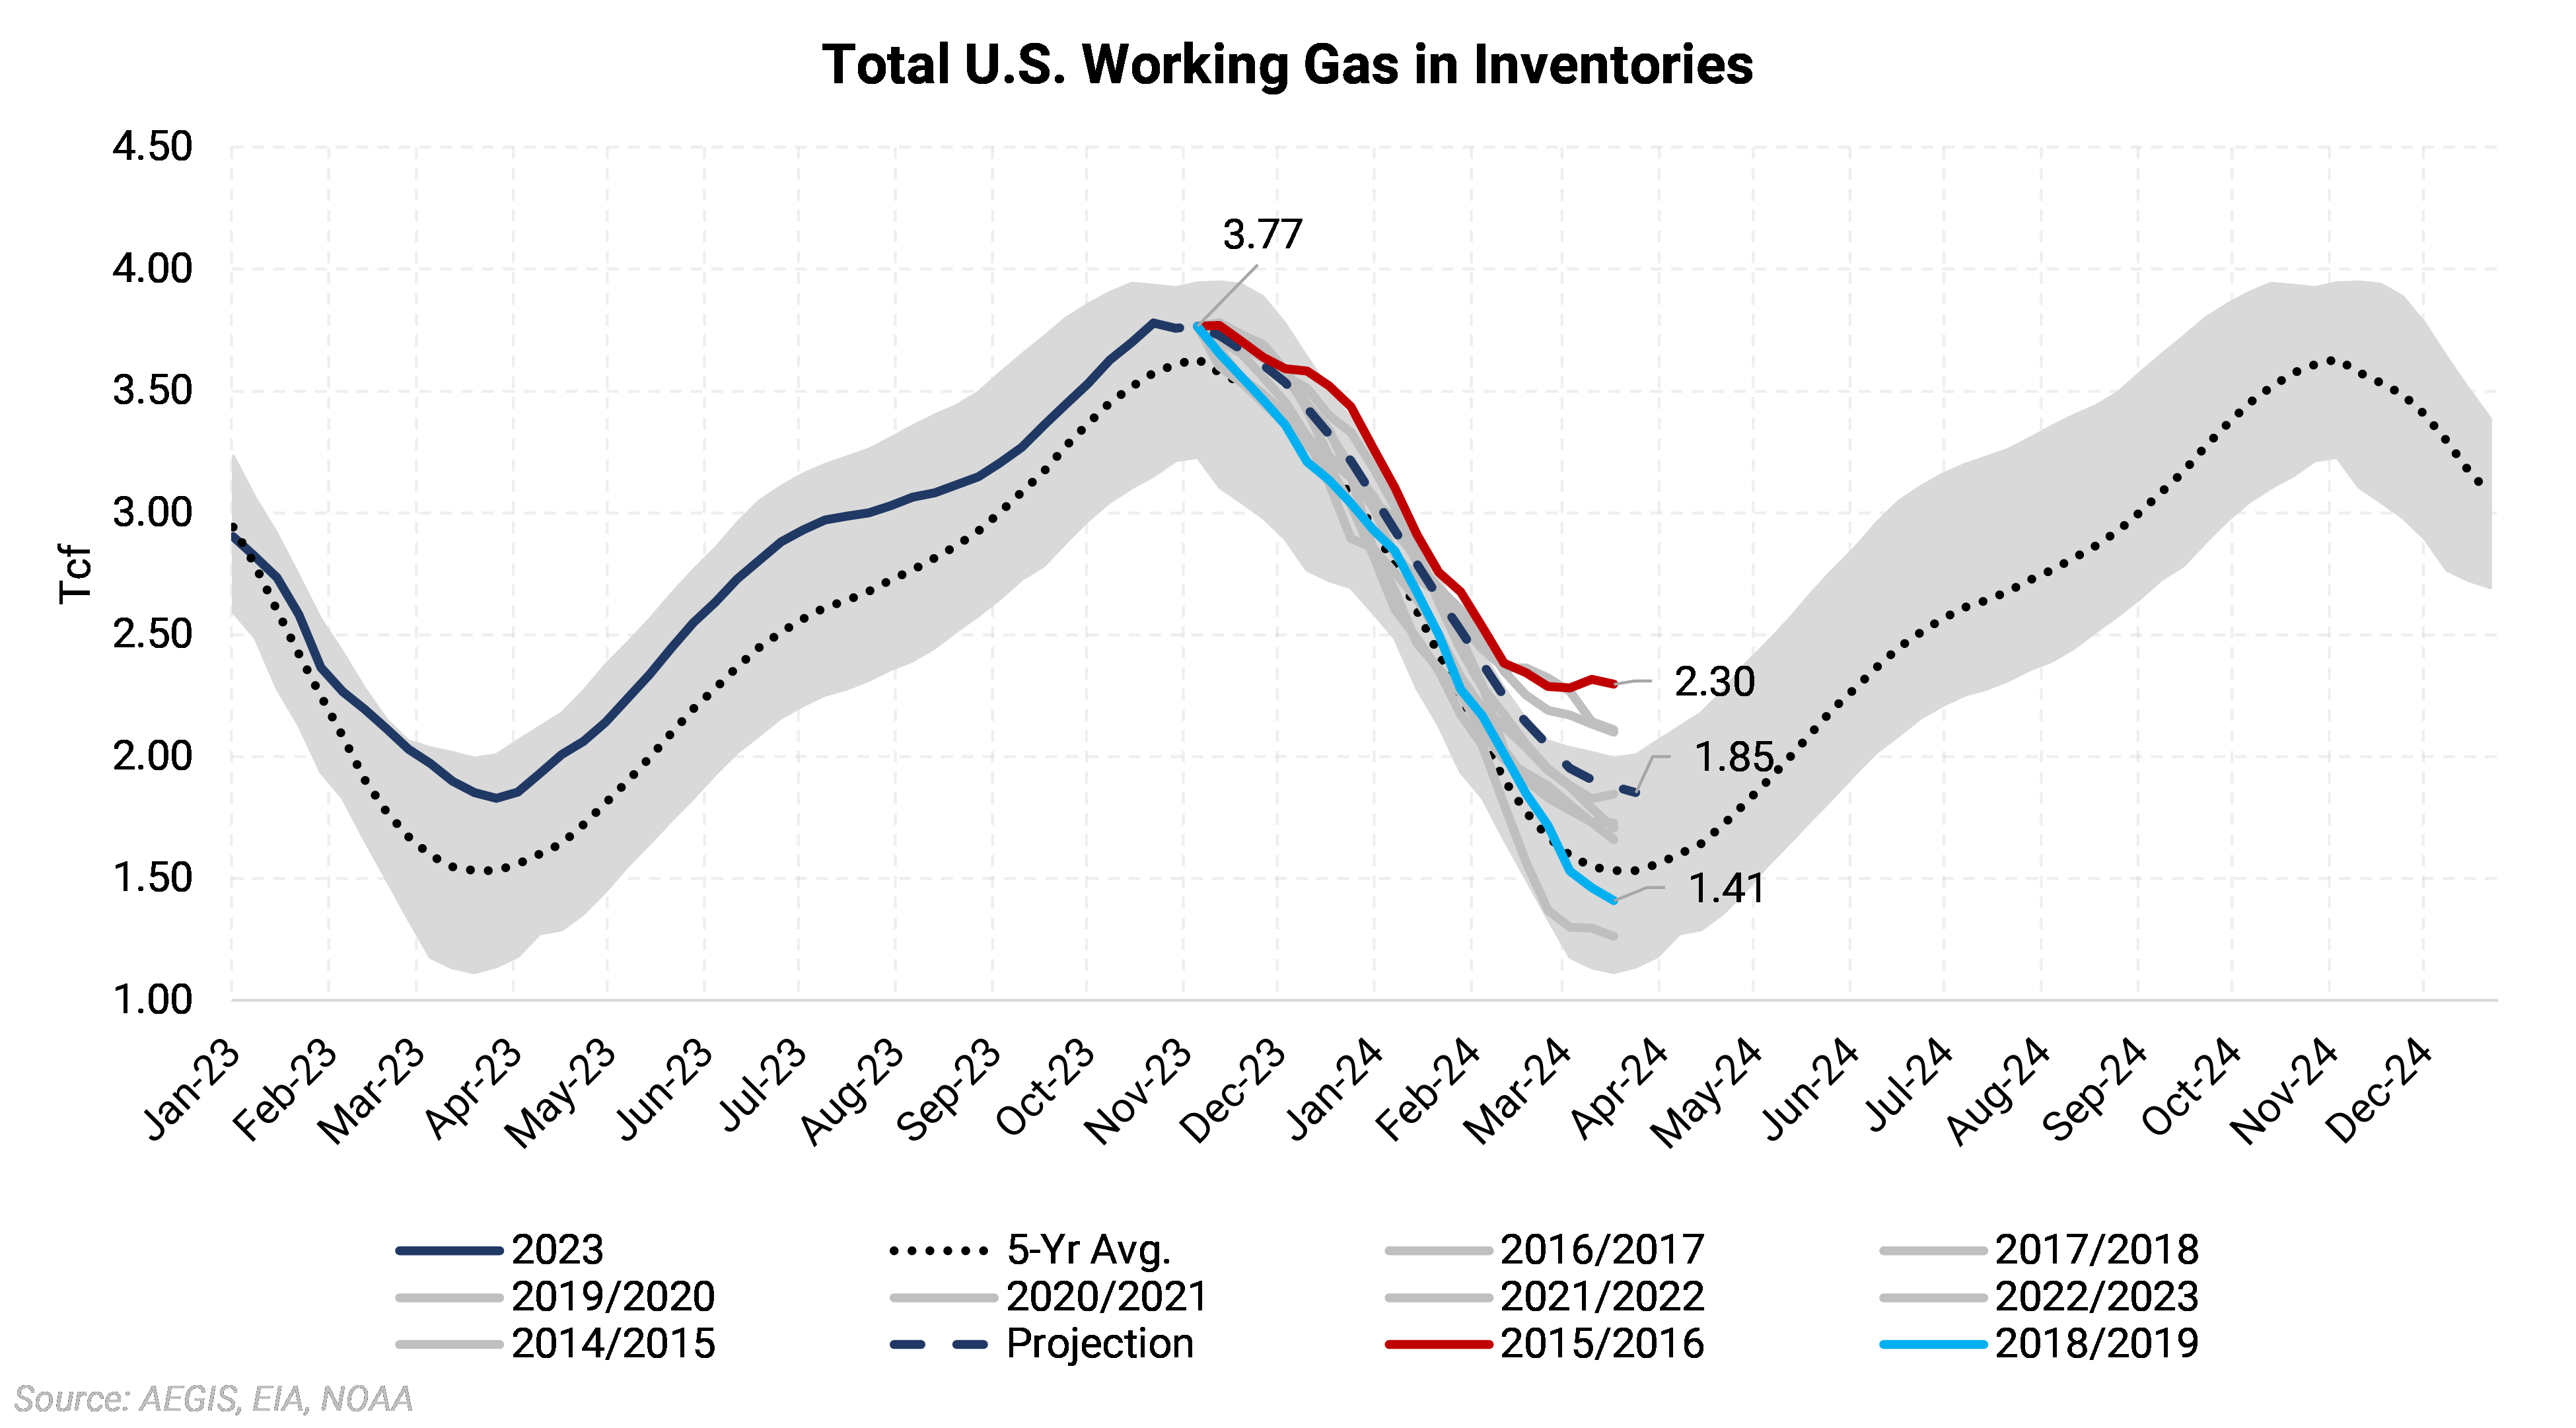
With only a few weeks remaining in the injection season, it appears Lower 48 gas inventories will start winter with about 3.77 Tcf in storage. The market is now looking ahead towards the end of the withdrawal season. Assuming 10-year average weather and without modulating for price, the withdrawal season looks like it may end up around 1.85 Tcf, a similar level to where the 2023 injection season began. However, this end-of-season number changes dramatically when swapping the 10-year average weather for other scenarios.

We have modeled nine different scenarios in the chart above using our temperature-adjusted supply and demand model. The dashed dark blue line labeled “projection” is our 10-year normal weather scenario. The grey lines use the same supply-demand balance but with the weather (in degree days) from each of the past nine winter seasons. The 2015/2016 winter is the mildest case of the past ten years, while 2018/2019 is the second coldest, behind the exceptionally cold 2014/2015 winter season.
Most of the projections lead to a March end-of-season number higher than the five-year average, with only the two coldest years being below. The mildest scenario shows inventories finishing the season at 2.30 Tcf, although it is unlikely that would happen even if there were the same number of HDDs. The reason for this is that price would likely react to the high storage level and come down to pick up more gas demand. While the model outcome may not be realistic, it would still imply a much lower price.

Source: NOAA
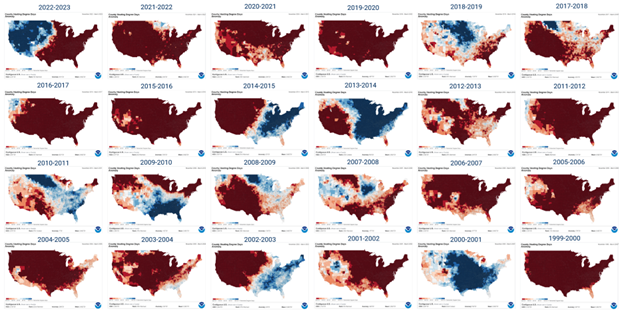
When looking empirically at weather over not just the last ten years but also the last 20 years, the vast majority of winter seasons have been significantly warmer than the 30-year normal. A colder winter is certainly possible, but we view the probability of that as being lower than a milder winter. In addition, it is important that the cold weather impacts the eastern half of the country, where the majority of demand is located.
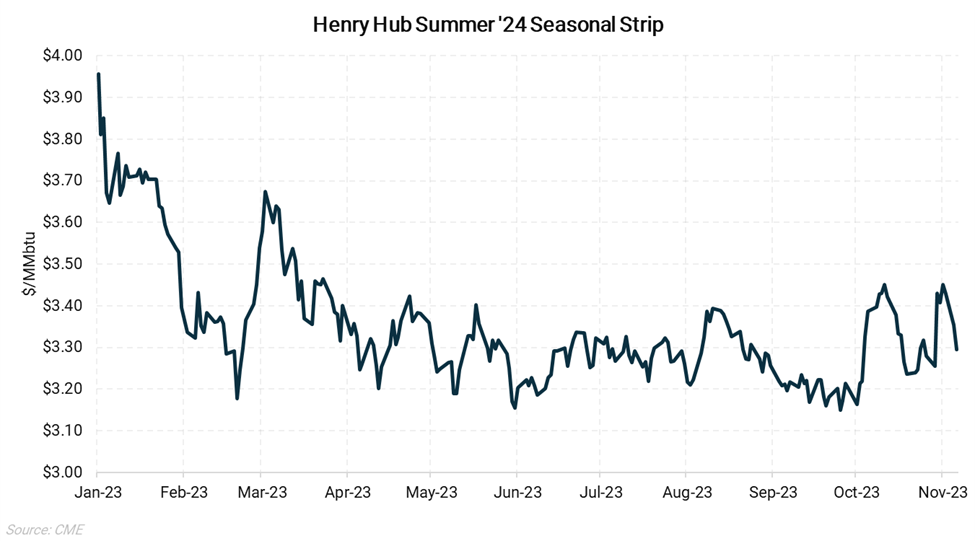
If any of the milder scenarios or even the ten-year normal scenario ends up playing out, we view these as being bearish for Summer ’24 Henry Hub. Our base projection, which ends at 1.85 Tcf, would be a similar starting point to this past summer. Anything higher than that would be even more bearish, and with Summer ’24 currently priced at $3.295/MMbtu, we see downside risk to the curve.