Natural gas has quickly lost the demand it gained during hot weather this summer. This new dynamic means the power market is desperate for gas as fuel on big power-demand days, and it shows the growing importance of natural gas in power reliability.
Power load has recently been at all-time highs in the U.S. Lower 48. Natural gas has acted as the marginal fuel for much of the summer. As power load (power demand) increased this summer, natural gas took on incrementally more share than other fuels. Then, as load retreated because of milder temperatures, gas lost share at a similarly quick rate.
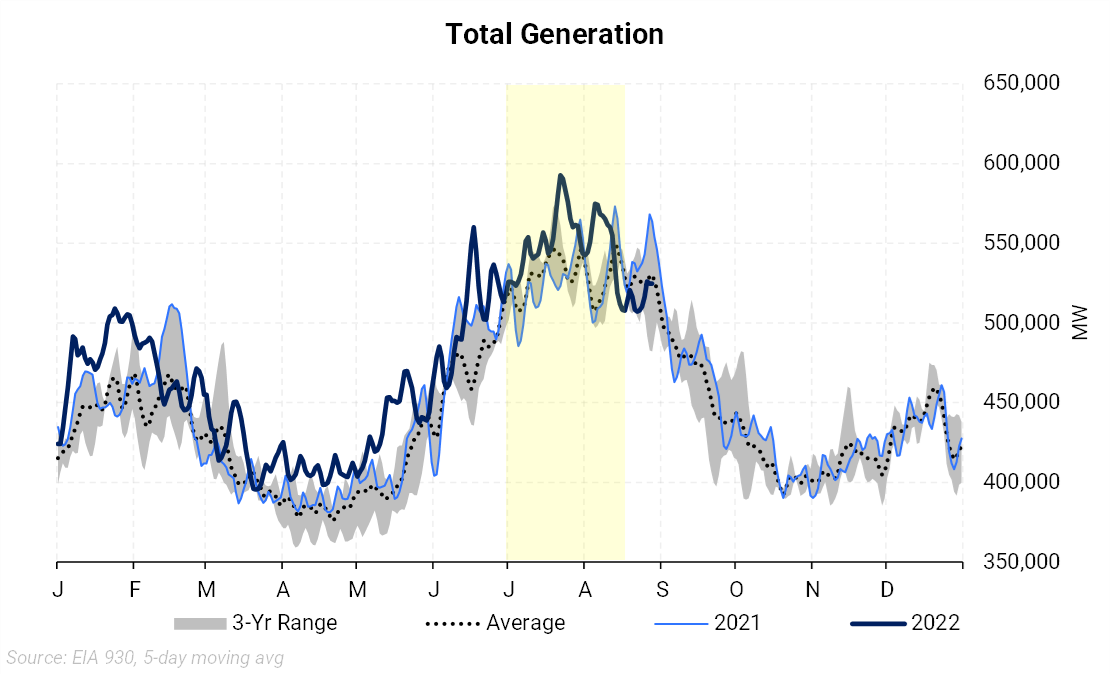
The chart below shows this summer’s total generation from all sources (dark blue line) compared to the previous three years’. Total generation averaged 550 GW between July 1 and August 17 this summer compared to 529 GW for the same period between 2019-2020.

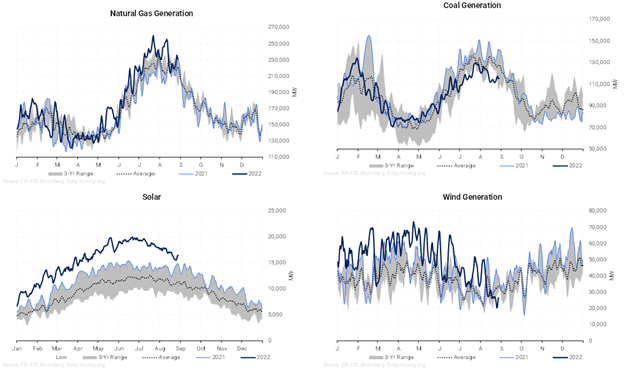
Note that “generation,” which is supply, roughly matches “load,” which is demand, because the power market has limited ability to store or import/export power. Which fuels or generation sources met this record-setting demand? To dissect the components that add up to the total load, we need to look at the six charts below.
As shown above, in August, total electric-generation demand (load) decreased from its July highs. The top two charts below show how both gas and coal were called on to produce less power. While both fuels were reduced, the natural gas market share fell more than coal’s.


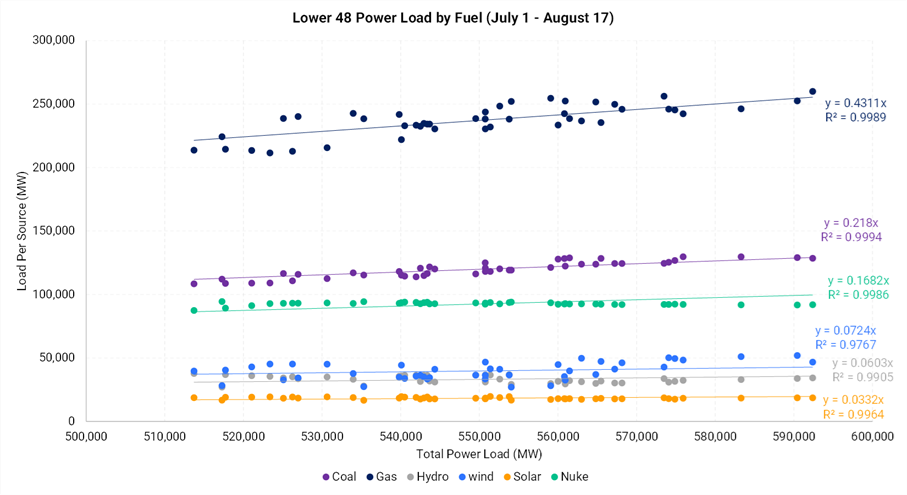
The chart below compares the rates of losses among the top generation sources. It shows the magnitude of gas and coal demand losses between July 1 and August 17. The vertical axis depicts generation from each source of power generation. The horizontal axis shows the total load for each day in our window. The slope of the line shows how many MW of generation is gained or lost for each MW increase in load. For example, the slope of the natural gas line is 0.4311, meaning gas lost 0.4311 MW of generation for each 1.0 MW of load decrease. Other generation sources were reduced, but gas and coal together accounted for 65% of the decrease (coal’s slope was 0.218, plus gas’s slope of 0.4311). Gas gained more share as load increased but lost more as load decreased, relative to coal.
The slope in the equation for each fuel should add up to 1.0 when added together, representing the full amount of power generation. In our sample, we get to 0.98 (0.43+0.21+0.16+0.072+0.06+0.033) as we excluded the small amount of petroleum generation.
Gas serves as a “gap” fuel that can quickly provide generation when the market needs it. The flexible nature of gas power plants shows up in the dispersion (distance of dot from the line) of data points around the regression line. Notice how the dispersion in coal is minimal; it was varying its output very little to serve load fluctuations. However, the dispersion among the gas data shows that gas generation was being used to fulfill surge demand.

Gas-powered generation is playing an ever-increasing role in the power sector, and usually at the expense of coal. Ten years ago, gas generation accounted for 25% of total generation versus coal’s 42%. As of today, those roles are essentially reversed; gas generates about 40% of total, while coal accounts for 22%. Natural gas is now participating at a higher level of baseload and has also proven capable of capturing surging demand when needed.